
Energy Surges While Tech Stumbles: ETF Momentum Shifts March 27, 2026
Date: March 27, 2026 (reflecting March 26, 2026 trading session)
Markets displayed a stark divergence on March 26, with energy commodities powering ahead while most sectors retreated. Oil (USO) leads with an exceptional momentum score of +461, signaling extraordinary strength over the past 9 days-yet weakened yesterday, suggesting momentum may be cooling. Against this backdrop, 12 of 14 sector ETFs posted negative momentum scores, with consumer discretionary (XLY) and materials (XLB) among the hardest hit. This creates a compelling tale of sector rotation: money appears to be flowing toward commodities and away from traditional equity sectors.
Bitcoin (IBIT) emerged as the second-strongest asset with a +129 momentum score, though it too showed signs of deceleration. Meanwhile, precious metals and industrial commodities retreated sharply, reflecting mixed signals about economic growth prospects and inflation expectations.
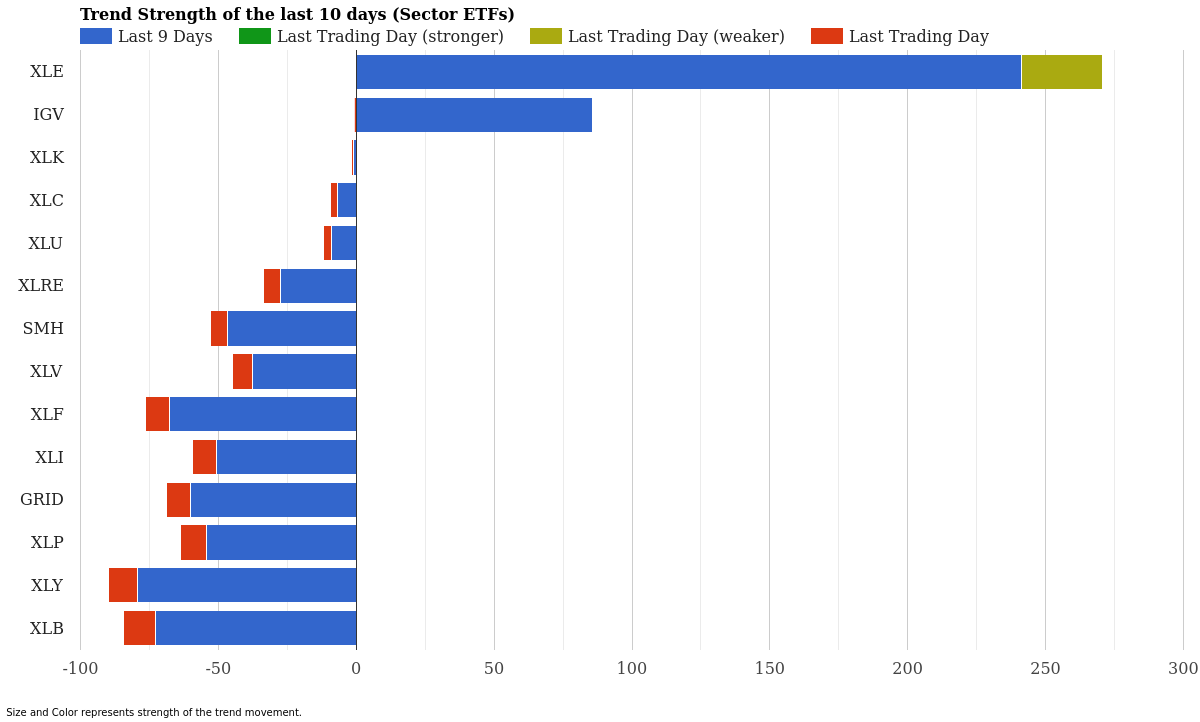
Sector ETF Trend Strength – Last 10 Days – March 27, 2026
Sector ETF Momentum Rankings
Energy stands alone in positive territory among equities. XLE commands attention with a +241 momentum score over nine days, though yesterday’s reading of -29 signals weakening momentum. Software (IGV) sits as the only other sector flirting with positive ground at +86, yet it too lost steam with a slight negative contribution yesterday.
The remaining 12 sectors occupy negative territory, ranging from minimal deterioration to severe declines. Consumer discretionary (XLY) faces the most challenging backdrop with a -79 momentum score, compounded by yesterday’s -11 contribution. Materials (XLB), industrials (XLI), and consumer staples (XLP) all show comparable weakness.
| Rank | ETF | Sector | 9-Day Strength | Yesterday | Signal |
|---|---|---|---|---|---|
| 1 | XLE | Energy | +241 | -29 | Weakening |
| 2 | IGV | Software | +86 | -1 | Slowing |
| 3 | XLK | Tech | -1 | -1 | Downtrend |
| 4 | XLC | Communications | -7 | -3 | Downtrend |
| 5 | XLU | Utilities | -9 | -3 | Downtrend |
| 6 | XLRE | Real Estate | -27 | -6 | Downtrend |
| 7 | XLV | Healthcare | -38 | -7 | Downtrend |
| 8 | SMH | Semiconductors | -47 | -6 | Downtrend |
| 9 | XLI | Industrials | -51 | -9 | Downtrend |
| 10 | XLP | Consumer Staples | -54 | -9 | Downtrend |
| 11 | GRID | Infrastructure | -60 | -9 | Downtrend |
| 12 | XLF | Financials | -68 | -9 | Downtrend |
| 13 | XLB | Materials | -73 | -12 | Downtrend |
| 14 | XLY | Consumer Discretionary | -79 | -11 | Downtrend |
The sector story boils down to this: traditional growth and cyclical plays are retreating while energy remains the sole bright spot. XLE’s weakening signal yesterday suggests even energy’s rally may be losing steam, which could signal a broader market inflection point worth monitoring closely.
Commodity ETF Momentum Rankings
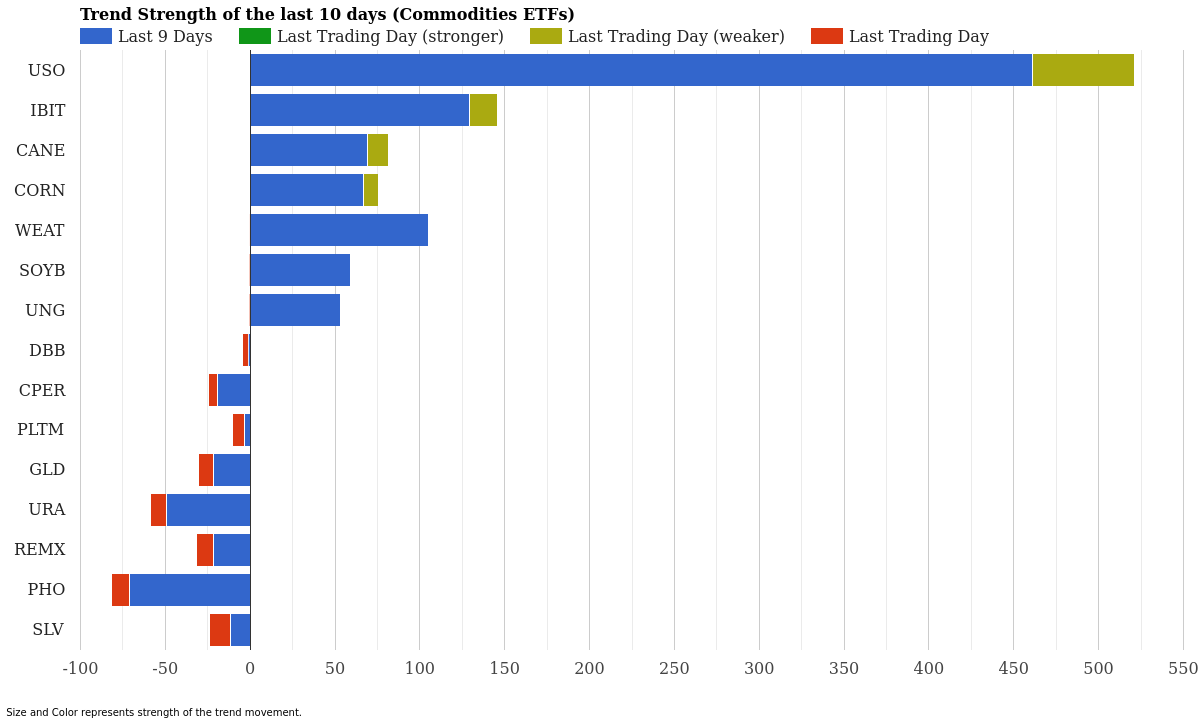
Commodity ETF Trend Strength – Last 10 Days – March 27, 2026
Commodities paint a starkly different picture than equities. Seven of 15 commodity ETFs maintain positive momentum scores, led by oil’s extraordinary +461 strength reading. Bitcoin follows at +129, signaling powerful upside momentum in risk assets despite weakening yesterday. Agricultural commodities-sugar (CANE), corn (CORN), and wheat (WEAT)-all sit in positive territory with momentum scores between +67 and +105.
However, weakness emerged yesterday across the commodity complex. USO’s -60 yesterday and IBIT’s -17 decline signal that even the strongest rallies may be catching their breath. Precious metals (GLD, SLV) and rare earths (URA, REMX) languish near the bottom with momentum scores of -22 to -50, indicating sustained selling pressure.
| Rank | ETF | Commodity | 9-Day Strength | Yesterday | Signal |
|---|---|---|---|---|---|
| 1 | USO | Oil | +461 | -60 | Weakening |
| 2 | IBIT | Bitcoin | +129 | -17 | Weakening |
| 3 | WEAT | Wheat | +105 | -0 | Slowing |
| 4 | CANE | Sugar | +69 | -13 | Weakening |
| 5 | CORN | Corn | +67 | -9 | Weakening |
| 6 | SOYB | Soybeans | +59 | -0 | Slowing |
| 7 | UNG | Natural Gas | +53 | -0 | Slowing |
| 8 | DBB | Base Metals | -1 | -4 | Downtrend |
| 9 | PLTM | Platinum | -3 | -8 | Downtrend |
| 10 | SLV | Silver | -12 | -12 | Downtrend |
| 11 | CPER | Copper | -19 | -6 | Downtrend |
| 12 | REMX | Rare Earths | -22 | -10 | Downtrend |
| 13 | GLD | Gold | -22 | -9 | Downtrend |
| 14 | URA | Uranium | -50 | -9 | Downtrend |
| 15 | PHO | Water | -71 | -11 | Downtrend |
Market Context and Interpretation
What we’re witnessing is a classic risk-on environment colliding with equity sector weakness. Oil and Bitcoin’s exceptional momentum readings suggest investors are hunting for outperformance in commodities and hard assets while rotating away from traditional equity sectors. Yet yesterday’s sharp pullbacks in both USO and IBIT inject a critical caveat: rallies built on fast momentum can reverse just as quickly.
The broad sector weakness across equities signals a potential economic growth concern. When 86% of sectors are in negative momentum territory, it typically suggests either profit-taking after an extended rally or genuine concern about corporate earnings ahead. Energy stands apart because crude supplies and geopolitical factors operate on different timelines than corporate earnings cycles.
Agricultural commodities remain interesting outliers. Wheat, soybeans, and corn have held positive momentum despite wider market skepticism, indicating that supply-side factors and global demand remain supportive for these assets. However, “slowing” signals in WEAT and SOYB suggest yesterday’s buying enthusiasm cooled slightly.
Key ETFs to Watch
Strongest Overall: USO dominates with a +461 momentum score, but yesterday’s sharp -60 decline raises red flags about sustainability. Watch whether oil holds above recent support levels or accelerates lower. IBIT’s +129 strength places Bitcoin as the second-most powerful asset, though its weakening signal mirrors oil’s predicament.
Notable Reversals: XLE’s transition to “weakening” represents the most significant shift. Energy was the sole bright spot in equities, and if that momentum breaks, expect broader market vulnerability. IGV’s slowing signal in software suggests even tech’s modest uptick may lack conviction.
Persistent Weakness: XLY and XLB deserve close attention. Consumer discretionary and materials have no tailwind whatsoever, with momentum scores of -79 and -73 respectively. These sectors typically lead economic slowdowns. PHO (water ETF) rounds out the weakness chart at -71, though this reflects broader infrastructure skepticism rather than fundamental shifts.
Conclusion
March 26 presented traders with a tale of divergence: commodities soaring while equities stumbled. Oil and Bitcoin commanded the momentum headlines, yet both displayed concerning weakening signals that cast doubt on momentum persistence. Meanwhile, equity sectors-barring energy-showed persistent negativity across a broad front, with consumer discretionary and materials leading the decline.
The challenge for investors centers on duration. Do energy and crypto continue their rallies or roll over from yesterday’s weakness? Can equity sectors find a bottom or do they deteriorate further? The data suggests heightened volatility and potential mean reversion, particularly if oil and Bitcoin continue pulling back. Monitor XLE and USO closely over the next trading session-if the weakening accelerates, broader market pressure may follow.
For traders seeking positioning, the unidirectional sector weakness argues for caution on broad equity exposure until we see stabilization. Commodity strength remains compelling for tactical views, but yesterday’s reversals demand respect for downside risk. Watch the three-day trend closely before committing to any new positions.
Disclaimer: This report is for informational purposes only and should not be construed as investment advice. Past momentum scores do not guarantee future results. Momentum analysis measures directional strength, not price targets or investment returns. Always conduct thorough due diligence and consult a qualified financial advisor before making investment decisions. All data reflects the trading session of March 26, 2026. Market conditions can shift rapidly.
Author Disclosure: The author may hold or has held positions in ETF-related instruments directly or through derivative constructs at the time of publication. This report reflects momentum analysis based on historical strength scores and is not a trading recommendation. Readers should verify all data independently before making financial decisions.
For more market analysis visit stockbotty.com | Disclaimer: stockbotty.com/disclaimer
—
More Momentum & Strength Articles
SHLD, GDX Lead as Utilities Plunge – Momentum August 22
Cybersecurity Climbs as Utilities Fade - August 22, 2026 Executive Summary Sector momentum shows ...
Aug 22, 2026Financials Lead, Utilities Collapse – August 21, 2026
Financials Lead as Utilities Collapse - August 21, 2026 Executive Summary Capital is rotating har...
Aug 21, 2026Commodities Lead as Sectors Fade – Momentum Rankings August 20
Commodities Surge as Tech Retreats - August 20, 2026 Executive Summary Commodity ETFs are command...
Aug 20, 2026Financials Lead as Utilities Collapse – August 19, 2026
Financials Lead as Utilities Slide - August 19, 2026 Capital is flowing into established financia...
Aug 19, 2026Financials Lead, Biotech Flips – ETF Momentum August 18
Financials Lead as Biotech Stalls - August 18, 2026 Executive Summary XLF (Financials) dominates ...
Aug 18, 2026