
Energy Surges While Tech Stumbles: ETF Momentum Shifts April 1, 2026
April 1, 2026 – Energy ETFs are commanding attention as oil and commodity prices show exceptional strength, while technology and consumer discretionary sectors face mounting pressure. Today’s momentum data reveals a sharply divergent market where defensive and commodity-linked assets are attracting capital, signaling a potential rotation away from growth-oriented equities.
Across 14 sector ETFs tracked, only 2 maintain positive momentum while 12 are in negative territory. The commodity complex tells a different story, with 7 of 15 ETFs showing positive momentum scores. Most striking: oil-linked USO continues its exceptional run with a +513.50 momentum score, though showing signs of weakening momentum on the day.
A critical trend reversal has emerged in materials (XLB), shifting from weakness into positive territory. This could signal renewed interest in cyclical recovery plays, even as the broader market struggles with headwinds.
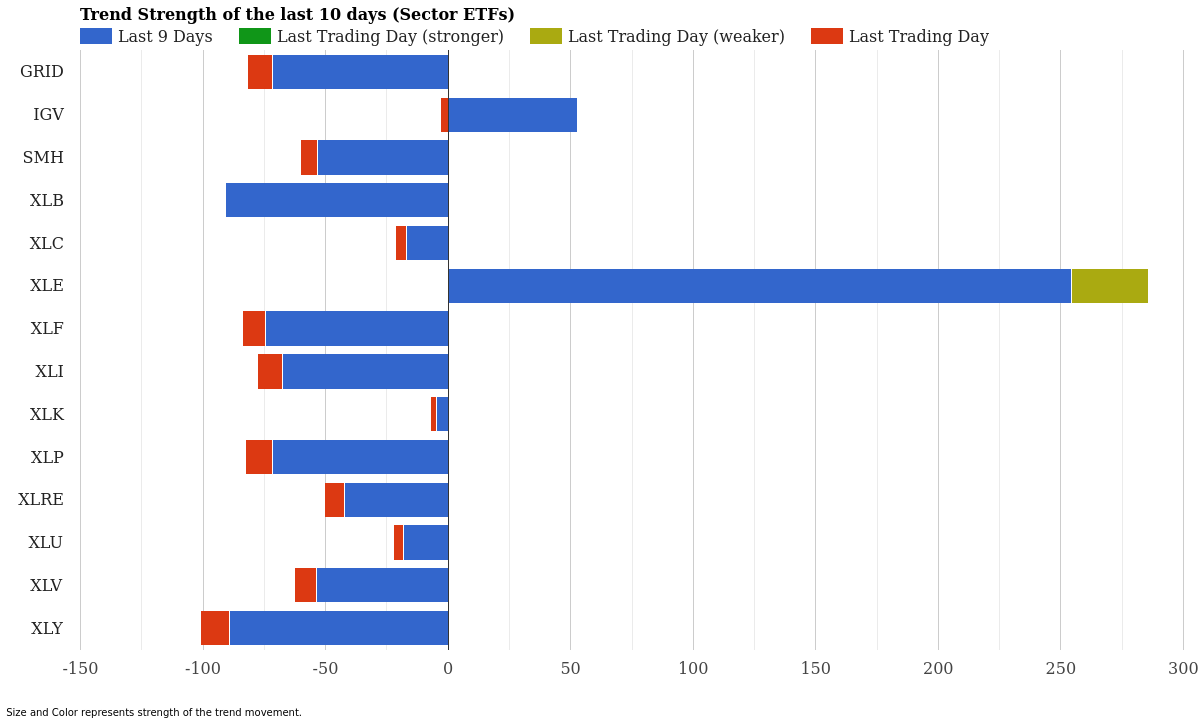
Sector ETF Trend Strength – Last 10 Days – April 01, 2026
Sector ETF Momentum Rankings
Energy leads by a commanding margin, but the leadership story becomes increasingly bearish the further you move down the rankings. Here’s what the numbers tell us about sector rotation and institutional capital flow:
| Rank | ETF | 10-Day Strength | Today’s Score | Signal |
|---|---|---|---|---|
| 1 | XLE | +254.31 | -31.42 | Weakening |
| 2 | IGV | +52.69 | -3.30 | Slowing |
| 3 | XLK | -4.80 | -2.35 | Downtrend |
| 4 | XLC | -16.80 | -4.85 | Downtrend |
| 5 | XLU | -18.03 | -4.16 | Downtrend |
| 6 | XLRE | -42.25 | -8.01 | Downtrend |
| 7 | SMH | -53.18 | -7.25 | Downtrend |
| 8 | XLV | -53.80 | -8.87 | Downtrend |
| 9 | XLI | -67.54 | -10.32 | Downtrend |
| 10 | XLP | -71.65 | -10.88 | Downtrend |
| 11 | GRID | -71.85 | -9.93 | Downtrend |
| 12 | XLF | -74.66 | -9.20 | Downtrend |
| 13 | XLY | -89.12 | -12.02 | Downtrend |
| 14 | XLB | -90.91 | +0.06 | Reversal |
XLE energy dominates with a +254.31 momentum score over the last nine days, reflecting oil’s remarkable rally. However, yesterday’s pullback of -31.42 signals weakening momentum even as the long-term trend remains powerfully bullish. This divergence warrants attention-momentum peaks often precede consolidation.
Software and cloud computing (IGV) holds the second-best position at +52.69, though it too is slowing with a negative daily score of -3.30. Beyond these two bright spots, the sector landscape deteriorates sharply. Consumer discretionary (XLY) records the heaviest losses with a -89.12 momentum score, continuing to struggle with pressure evident in yesterday’s -12.02 daily decline.
Most importantly: XLB (materials) has reversed. After plumbing negative territory at -90.91, it flipped positive yesterday with a +0.06 score. While modest, this reversal could indicate institutional interest in cyclical recovery positioning ahead of potential economic improvement.
Commodity ETF Momentum Rankings
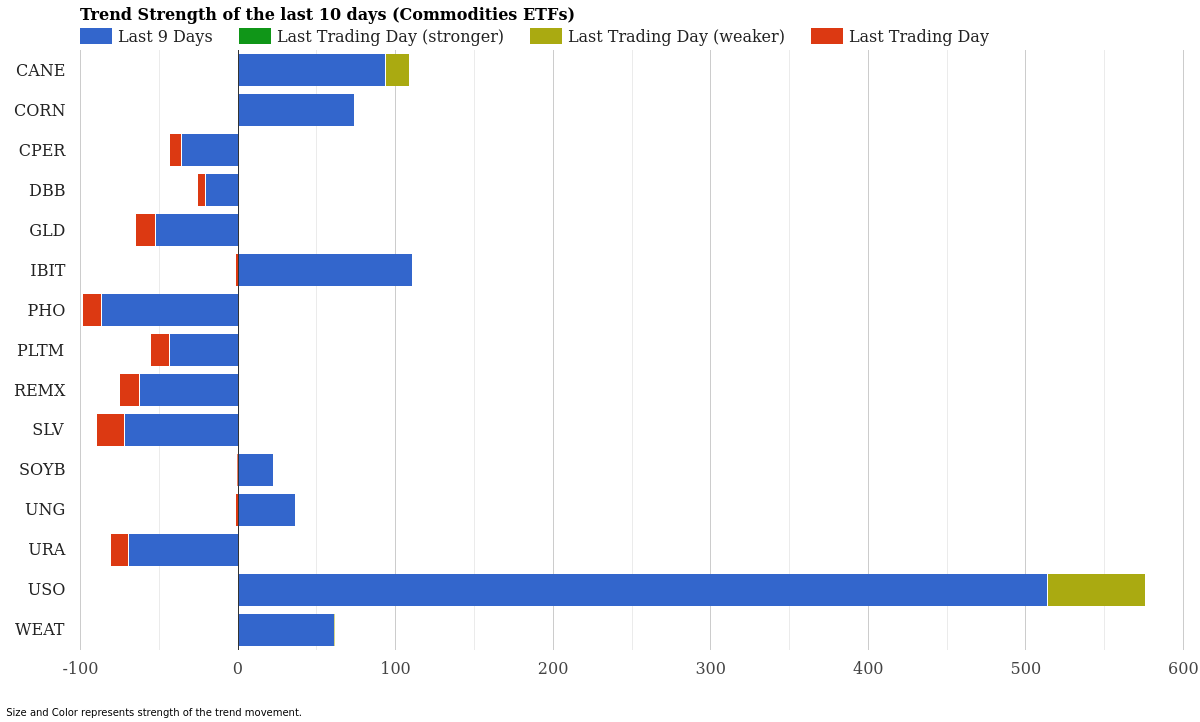
Commodity ETF Trend Strength – Last 10 Days – April 01, 2026
Commodities present a markedly different picture from equities. Where sectors largely suffer, energy and agricultural commodities show genuine strength. Oil futures (USO) commands the stage with an exceptional +513.50 momentum score, though like XLE, it shows fatigue with a -62.56 pullback yesterday. Weakness in a dominant leader often prompts profit-taking.
| Rank | ETF | 10-Day Strength | Today’s Score | Signal |
|---|---|---|---|---|
| 1 | USO | +513.50 | -62.56 | Weakening |
| 2 | IBIT | +110.48 | -1.38 | Slowing |
| 3 | CANE | +93.60 | -15.37 | Weakening |
| 4 | CORN | +73.86 | -0.02 | Slowing |
| 5 | WEAT | +61.08 | -0.10 | Weakening |
| 6 | UNG | +36.20 | -1.52 | Slowing |
| 7 | SOYB | +22.42 | -0.57 | Slowing |
| 8 | DBB | -20.86 | -4.92 | Downtrend |
| 9 | CPER | -36.02 | -7.19 | Downtrend |
| 10 | PLTM | -43.71 | -11.64 | Downtrend |
| 11 | GLD | -52.42 | -12.88 | Downtrend |
| 12 | REMX | -62.66 | -12.52 | Downtrend |
| 13 | URA | -69.32 | -11.52 | Downtrend |
| 14 | SLV | -71.88 | -17.67 | Downtrend |
| 15 | PHO | -86.92 | -11.74 | Downtrend |
Seven commodities ETFs showing positive momentum represent genuine strength. Bitcoin (IBIT) ranks second with +110.48, suggesting alternative assets continue attracting capital. Sugar (CANE), corn (CORN), and wheat (WEAT) all trade above zero, indicating agricultural optimism, though all three are weakening on the daily timeframe.
Precious metals and industrial metals collapse. Silver (SLV) suffers the steepest losses across all commodities at -71.88 momentum score with a severe -17.67 daily pullback. Gold (GLD) follows closely at -52.42, and water (PHO) records the weakest score overall at -86.92. Copper (CPER) and uranium (URA) also remain deeply negative, signaling reduced industrial and energy demand expectations.
Market Context & Interpretation
A clear bifurcation has emerged. Inflation-hedging commodities-especially energy-are booming while equity sectors face headwinds. This pattern typically signals either inflationary expectations or geopolitical supply concerns driving commodity prices upward independent of broad economic optimism. If energy rallies continue, we could see downstream pressure on consumer spending via fuel and heating costs.
The 12 negative-momentum sectors versus only 2 positive suggests institutional investors are rotating defensively or into specific pockets like software. Consumer discretionary’s weakness at -89.12 is particularly telling-consumers may be pulling back amid inflation or uncertainty.
That XLB materials has reversed from deep weakness is noteworthy. Materials typically lead economic rebounds, so this shift could indicate forward-looking positioning ahead of potential recovery catalysts. Paired with energy’s dominance, it suggests market insiders are betting on industrial acceleration despite today’s broader sector struggles.
Bitcoin (IBIT) remaining strong at +110.48 alongside energy leadership creates an unusual alliance: hard assets and alternative currencies rallying together. This combination historically appears during periods of currency debasement or crisis hedging. Equity investors should note this divergence carefully.
Key ETFs to Watch
Strongest performers: USO dominates with +513.50 momentum score, followed by IBIT at +110.48 and CANE at +93.60. These three represent energy, digital assets, and agricultural strength-unconventional allies pointing toward commodity supercycle positioning.
Critical reversal: XLB’s turnaround from -90.91 to +0.06 deserves monitoring. If this holds and strengthens, it signals cyclical recovery trades gaining traction and could foreshadow broader market leadership shift toward industrials and materials.
Persistent weakness: XLY consumer discretionary at -89.12 and XLE’s daily pullback suggest caution. Even energy’s strong momentum cannot override consumer spending deterioration. Watch whether USO and XLE momentum persists or continues fading-momentum peaks often precede reversals.
Conclusion
April 1, 2026 presents a market split between resilient commodities and struggling equities. Energy and agricultural strength, combined with materials’ reversal, suggest rotation into hard assets and cyclical positioning. However, weakening daily momentum across top performers-especially USO’s -62.56 pullback-indicates these rallies may be consolidating or peaking.
The most actionable signal remains materials’ reversal. If XLB strengthens further, it could mark the beginning of broader industrial and cyclical sector leadership, pulling capital from the defensive sectors currently underperforming. For now, traders should balance energy and commodity conviction against near-term momentum deceleration signals.
Equity sector performance remains deeply negative across the board. Until leadership shifts materially, the message is clear: capital is flowing toward hard assets and away from traditional growth and defensive equity plays.
For more market analysis visit stockbotty.com | Disclaimer: stockbotty.com/disclaimer
—
More Momentum & Strength Articles
SHLD, GDX Lead as Utilities Plunge – Momentum August 22
Cybersecurity Climbs as Utilities Fade - August 22, 2026 Executive Summary Sector momentum shows ...
Aug 22, 2026Financials Lead, Utilities Collapse – August 21, 2026
Financials Lead as Utilities Collapse - August 21, 2026 Executive Summary Capital is rotating har...
Aug 21, 2026Commodities Lead as Sectors Fade – Momentum Rankings August 20
Commodities Surge as Tech Retreats - August 20, 2026 Executive Summary Commodity ETFs are command...
Aug 20, 2026Financials Lead as Utilities Collapse – August 19, 2026
Financials Lead as Utilities Slide - August 19, 2026 Capital is flowing into established financia...
Aug 19, 2026Financials Lead, Biotech Flips – ETF Momentum August 18
Financials Lead as Biotech Stalls - August 18, 2026 Executive Summary XLF (Financials) dominates ...
Aug 18, 2026