
Energy Surges, Tech Crumbles: Major Sector Rotation on March 23
Markets displayed a stark divergence on March 23, 2026: commodities and energy assets powered ahead with exceptional momentum scores, while traditional sectors retreated sharply. Energy ETF XLE leads with a +230.38 momentum score over the last nine trading days, yet showed signs of weakening as yesterday’s session contributed a -27.13 score. Meanwhile, discretionary consumer stocks (XLY) suffered the steepest decline among sectors with a -69.12 nine-day momentum score. Commodities told a different story entirely: crude oil (USO) exploded higher with a +358.42 momentum score, signaling powerful upward momentum that dominated the market landscape.
This report reflects momentum data from the trading session on March 22, 2026 (published March 23). The overall market tone reveals classic risk-on behavior in commodities paired with defensive weakness in equities, suggesting investors rotated capital toward hard assets while reducing exposure to economically-sensitive sectors.
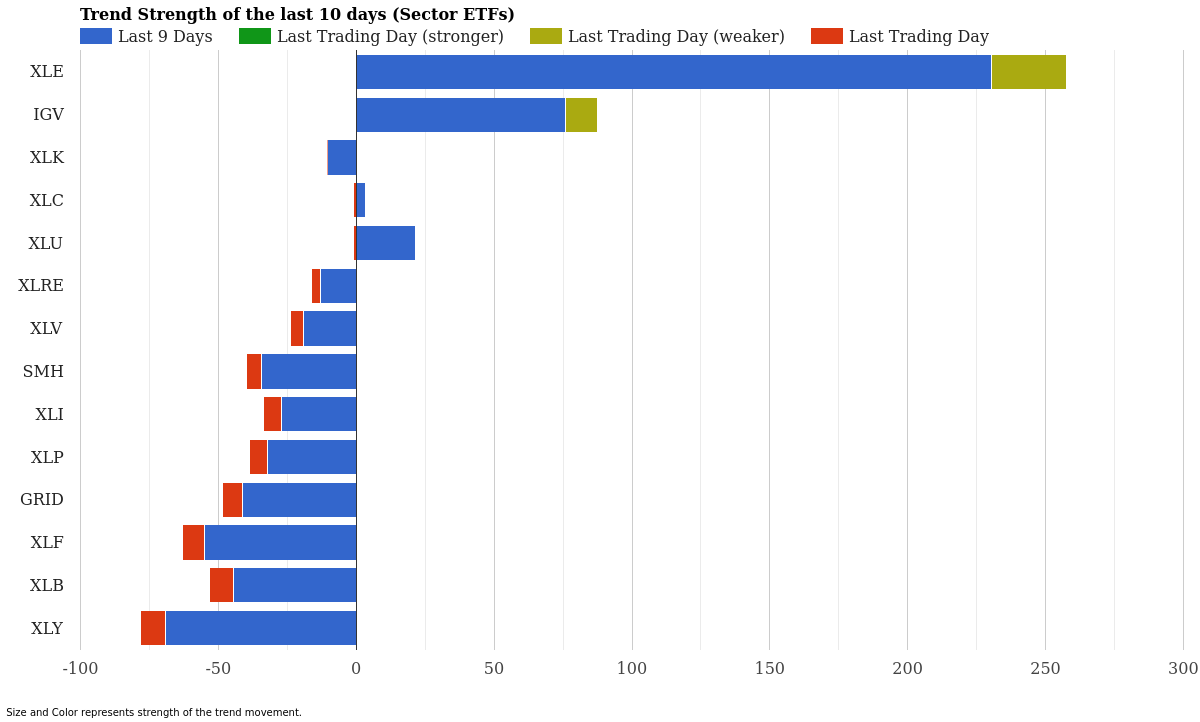
Sector ETF Trend Strength – Last 10 Days – March 23, 2026
Sector ETF Momentum Rankings
| Rank | ETF | 10-Day Strength | Yesterday | Signal |
|---|---|---|---|---|
| 1 | XLE | +230.38 | -27.13 | Weakening |
| 2 | IGV | +75.85 | -11.57 | Weakening |
| 3 | XLU | +21.48 | -0.92 | Slowing |
| 4 | XLC | +3.52 | -0.84 | Slowing |
| 5 | XLK | -10.36 | -0.11 | Downtrend |
| 6 | XLRE | -13.06 | -3.28 | Downtrend |
| 7 | XLV | -19.18 | -4.64 | Downtrend |
| 8 | XLI | -27.24 | -6.36 | Downtrend |
| 9 | XLP | -32.20 | -6.52 | Downtrend |
| 10 | SMH | -34.25 | -5.56 | Downtrend |
| 11 | GRID | -41.27 | -7.20 | Downtrend |
| 12 | XLB | -44.41 | -8.84 | Downtrend |
| 13 | XLF | -55.04 | -7.95 | Downtrend |
| 14 | XLY | -69.12 | -9.09 | Downtrend |
Only 4 of 14 sectors maintained positive nine-day momentum scores-and three of those are slowing. Energy (XLE) and technology services (IGV) represent the only genuinely strong performers, though both showed unmistakable signs of weakening as yesterday’s session produced negative momentum contributions. Energy weakness came despite its towering +230.38 score, signaling that the initial strength is cooling rapidly.
The remaining 10 sectors all printed negative momentum scores over the nine-day window. Financials (XLF) suffered the worst collapse at -55.04, followed by materials (XLB) at -44.41. Consumer discretionary (XLY) extended its downtrend to a brutal -69.12, indicating sustained selling pressure in growth-sensitive equities. Technology (SMH) weakness at -34.25 confirms the broader tech sector malaise beyond just semiconductors, suggesting systematic de-risking across the technology complex.
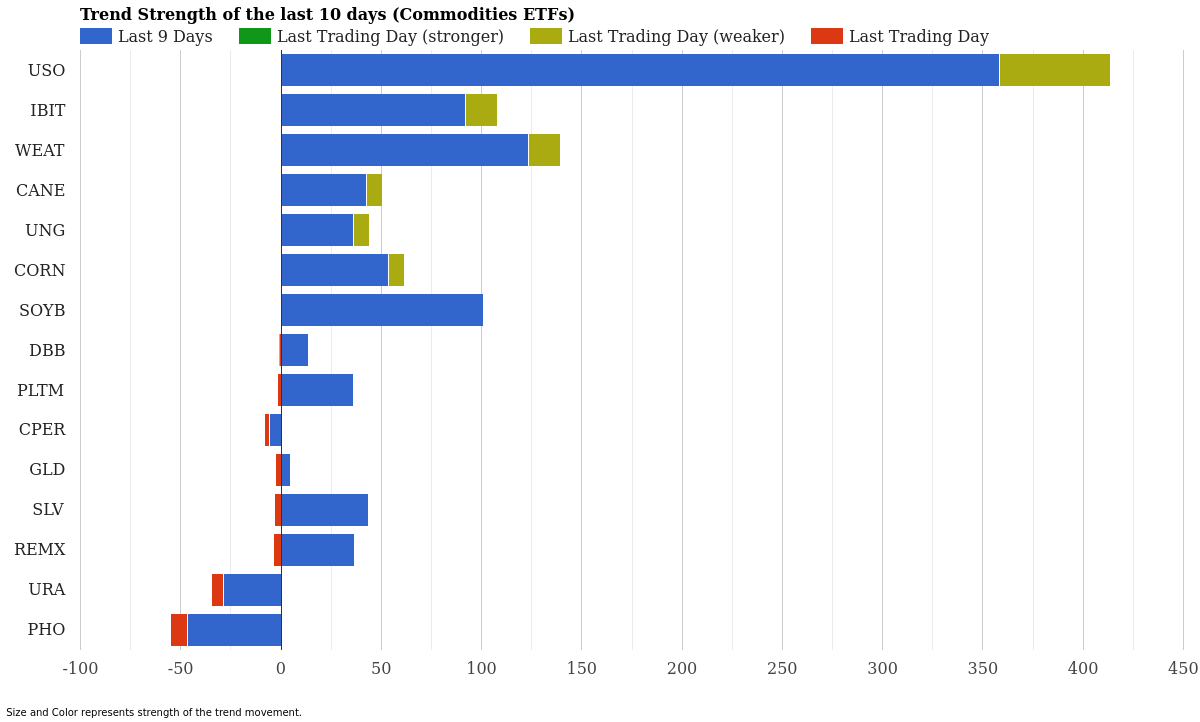
Commodity ETF Trend Strength – Last 10 Days – March 23, 2026
Commodity ETF Momentum Rankings
| Rank | ETF | 10-Day Strength | Yesterday | Signal |
|---|---|---|---|---|
| 1 | USO | +358.42 | -54.94 | Weakening |
| 2 | WEAT | +123.57 | -15.56 | Weakening |
| 3 | SOYB | +101.19 | -0.02 | Slowing |
| 4 | IBIT | +91.97 | -15.75 | Weakening |
| 5 | CORN | +53.75 | -7.82 | Weakening |
| 6 | SLV | +43.68 | -3.47 | Slowing |
| 7 | CANE | +42.38 | -8.14 | Weakening |
| 8 | REMX | +36.72 | -3.98 | Slowing |
| 9 | PLTM | +36.04 | -1.83 | Slowing |
| 10 | UNG | +36.02 | -7.92 | Weakening |
| 11 | DBB | +13.71 | -0.97 | Slowing |
| 12 | GLD | +4.81 | -2.57 | Slowing |
| 13 | CPER | -5.71 | -2.37 | Downtrend |
| 14 | URA | -28.52 | -6.01 | Downtrend |
| 15 | PHO | -46.40 | -8.67 | Downtrend |
Commodity markets paint an entirely different picture. 12 of 15 commodity ETFs maintain positive momentum scores, with crude oil leading by a massive margin. USO’s extraordinary +358.42 momentum score demonstrates the exceptional strength in energy commodities, though yesterday’s -54.94 contribution signals weakening momentum. Agricultural commodities also impressed: wheat (WEAT) scored +123.57 and soybeans (SOYB) registered +101.19.
Bitcoin-related exposure through IBIT showed compelling strength with a +91.97 nine-day momentum score, placing it fourth overall among all commodities. Precious metals remain modestly positive: silver (SLV) scored +43.68 and gold (GLD) contributed +4.81, suggesting safe-haven buying is occurring but at measured pace.
Only three commodities show negative momentum: uranium (URA) at -28.52, water (PHO) at -46.40, and copper (CPER) at -5.71. The water ETF downturn is particularly notable given its usual defensive appeal.
Market Context & Interpretation
What unfolded on March 23 represents a textbook risk-off rotation-but with a modern twist. Typically, risk-off means moving to bonds and gold. Instead, investors appeared to be rotating from equities into commodity exposure, particularly crude oil. This behavior suggests concern about near-term equity valuations rather than systemic financial stress.
Energy’s powerful +230.38 momentum over nine days dominates everything else in the sector universe. The weakness in yesterday’s session (-27.13) might represent profit-taking rather than fundamental deterioration, especially given crude’s global supply constraints and geopolitical tensions that typically support higher prices. Agricultural commodities showing exceptional momentum alongside energy suggests inflation expectations may be ticking upward.
Conversely, equities suffered systematic pressure across the board. Consumer discretionary weakness at -69.12 momentum makes economic sense if investors anticipate higher borrowing costs to combat inflation. Financials collapsing to -55.04 typically indicates bond market stress-rising rates erode bank profitability and net interest margins. Technology weakness extending to semiconductors (SMH) suggests the sector rotation isn’t limited to defensive names but includes growth-sensitive businesses more broadly.
Utilities (XLU) at +21.48 remains the strongest equity sector, confirming investors are seeking stable, dividend-paying alternatives as they de-risk. Communications services (XLC) barely holding positive territory suggests even defensive equity sectors are facing headwinds.
Key ETFs to Watch
Top Performers Across Both Asset Classes:
USO dominates with its +358.42 momentum score, marking the highest reading across sectors and commodities. This exceptional strength reflects growing supply concerns and potential geopolitical premium pricing. Monitor whether yesterday’s -54.94 contribution represents a durable reversal or temporary consolidation-crude above recent highs typically attracts momentum buying that can quickly reverse.
XLE’s +230.38 score makes it the second-strongest ETF overall, yet its weakening signal deserves attention. The energy sector has already captured the upside from crude’s rally, and yesterday’s momentum contribution turned negative. This creates a critical juncture: energy stocks could either consolidate gains or face profit-taking if crude stabilizes.
WEAT’s +123.57 momentum places it third and signals serious demand for agricultural protection strategies. With global food inflation concerns and weather volatility, grain prices deserve continued monitoring.
Trend Reversals & Weakness Signals:
Both commodity leaders (USO and WEAT) and energy stocks (XLE) display the same pattern: exceptional nine-day momentum with yesterday’s session showing negative contributions. This “weakening” signal suggests these moves may be topping out. Traders should watch whether these ETFs print new momentum highs or roll over in coming sessions.
XLY’s brutal -69.12 momentum score represents the most severe sector deterioration. Consumer discretionary weakness typically indicates either economic concerns or rate-driven valuation contraction. If this trend persists, it would confirm broader equity market challenges beyond energy.
Water (PHO) at -46.40 momentum surprised-this defensive infrastructure play usually holds up better in risk-off environments. Its weakness suggests either sector-specific challenges or a broader commodity complex correction that spilled beyond just oil and grains.
Conclusion
March 23, 2026 marked a decisive tilt toward commodities and away from equities, with energy leading the commodity surge while equity sectors retreated almost uniformly. The bifurcated performance-soaring commodity momentum paired with collapsing equity sector scores-suggests investors are recalibrating for potential inflation and economic slowdown simultaneously.
The weakening signals in top performers (USO, WEAT, XLE) inject caution into what might otherwise appear to be a clear bullish setup. Momentum that’s beginning to fade often leads to consolidation or reversal. Traders should watch whether these leaders regain strength or fade further in coming days. Meanwhile, equity investors face the challenge that even defensive sectors (utilities, staples) show minimal positive momentum, suggesting no safe harbor in traditional equity plays during this period.
The commodity complex’s dominance-particularly crude oil’s exceptional momentum-will likely continue driving market narratives until inflation signals soften or geopolitical tensions ease. For now, the message is clear: hard assets led, equities lagged, and momentum may be reaching inflection points.
DISCLAIMER: This analysis is for educational and informational purposes only and should not be construed as investment advice, a recommendation to buy or sell any security, or an endorsement of any trading strategy. Momentum scores and ETF movements can change rapidly, and past performance does not guarantee future results. All trading involves substantial risk of loss. Before making any investment decision, consult a qualified financial advisor and conduct your own thorough due diligence. StockBotty makes no representations about the accuracy, completeness, or timeliness of this data.
AUTHOR DISCLOSURE: The author may hold or has held positions in ETF-related instruments directly or through derivative constructs at the time of publication. This is not a trading recommendation.
For more market analysis and daily momentum reports, visit stockbotty.com | Disclaimer: stockbotty.com/disclaimer
—
More Momentum & Strength Articles
SHLD, GDX Lead as Utilities Plunge – Momentum August 22
Cybersecurity Climbs as Utilities Fade - August 22, 2026 Executive Summary Sector momentum shows ...
Aug 22, 2026Financials Lead, Utilities Collapse – August 21, 2026
Financials Lead as Utilities Collapse - August 21, 2026 Executive Summary Capital is rotating har...
Aug 21, 2026Commodities Lead as Sectors Fade – Momentum Rankings August 20
Commodities Surge as Tech Retreats - August 20, 2026 Executive Summary Commodity ETFs are command...
Aug 20, 2026Financials Lead as Utilities Collapse – August 19, 2026
Financials Lead as Utilities Slide - August 19, 2026 Capital is flowing into established financia...
Aug 19, 2026Financials Lead, Biotech Flips – ETF Momentum August 18
Financials Lead as Biotech Stalls - August 18, 2026 Executive Summary XLF (Financials) dominates ...
Aug 18, 2026