
Energy Surges While Tech Reverses: ETF Momentum Shifts April 09, 2026
April 09, 2026 – Today’s momentum data reveals a fascinating market divergence. Energy commodities are experiencing explosive strength while traditional technology and consumer sectors face sustained pressure. With 9 out of 14 sector ETFs showing trend reversals and oil-linked instruments posting extraordinary momentum scores, we’re witnessing a classic sector rotation away from growth and into defensive positions.
The overall market tone leans cautiously bullish on commodities but bearish on discretionary sectors. While most sector ETFs remain deeply negative over the past 9 trading days, yesterday’s session brought meaningful relief rallies to materials, financials, semiconductors, and industrials. Meanwhile, consumer staples and discretionary segments continue their sharp downward spiral.
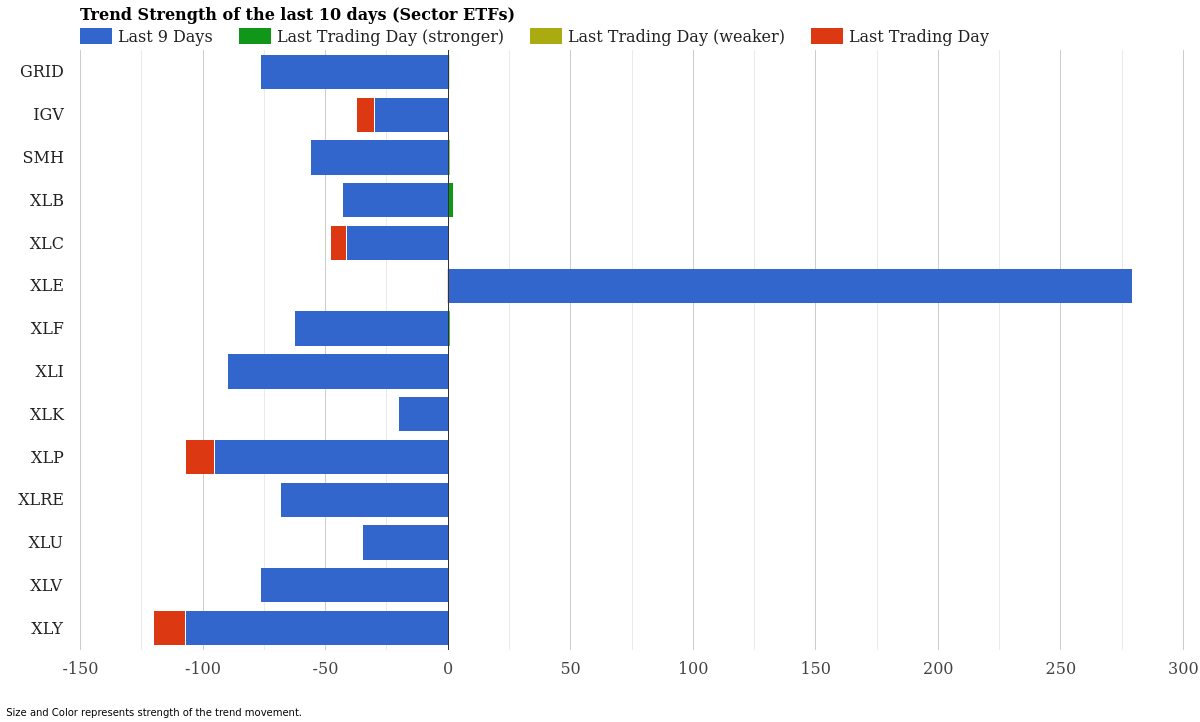
Sector ETF Trend Strength – Last 10 Days – April 09, 2026
Sector ETF Momentum Rankings
| Rank | ETF | 10-Day Strength | Yesterday | Signal |
|---|---|---|---|---|
| 1 | XLE (Energy) | +279.16 | -0.19 | Slowing |
| 2 | XLK (Technology) | -20.13 | +0.15 | Reversal |
| 3 | IGV (Software) | -30.10 | -7.22 | Downtrend |
| 4 | XLU (Utilities) | -35.02 | +0.03 | Reversal |
| 5 | XLC (Telecom) | -41.34 | -6.53 | Downtrend |
| 6 | XLB (Materials) | -43.02 | +2.11 | Reversal |
| 7 | SMH (Semiconductors) | -55.98 | +0.55 | Reversal |
| 8 | XLF (Financials) | -62.50 | +0.64 | Reversal |
| 9 | XLRE (Real Estate) | -68.48 | +0.16 | Reversal |
| 10 | GRID (Utilities) | -76.47 | +0.42 | Reversal |
| 11 | XLV (Healthcare) | -76.62 | +0.06 | Reversal |
| 12 | XLI (Industrials) | -89.93 | +0.24 | Reversal |
| 13 | XLP (Staples) | -95.41 | -11.69 | Downtrend |
| 14 | XLY (Discretionary) | -107.02 | -13.31 | Downtrend |
Energy’s exceptional momentum score of +279.16 dominates the sector landscape, though yesterday’s slight negative reading suggests the rally may be consolidating. More intriguing are the 9 trend reversals that emerged overnight.
XLK (Technology) and XLU (Utilities) reversed with minimal positive momentum, while materials, semiconductors, and financials showed more pronounced bounces. This broad-based reversal across previously declining sectors signals potential mean-reversion trading or relief rally conditions. However, XLP (Consumer Staples) and XLY (Consumer Discretionary) remain in freefall with -95.41 and -107.02 momentum scores respectively, indicating sustained selling pressure in consumer-facing businesses.
IGV (Software) and XLC (Telecom) also show persistent downward momentum, suggesting growth-oriented and communication stocks continue facing headwinds independent of the broader reversal pattern.
Commodity ETF Momentum Rankings
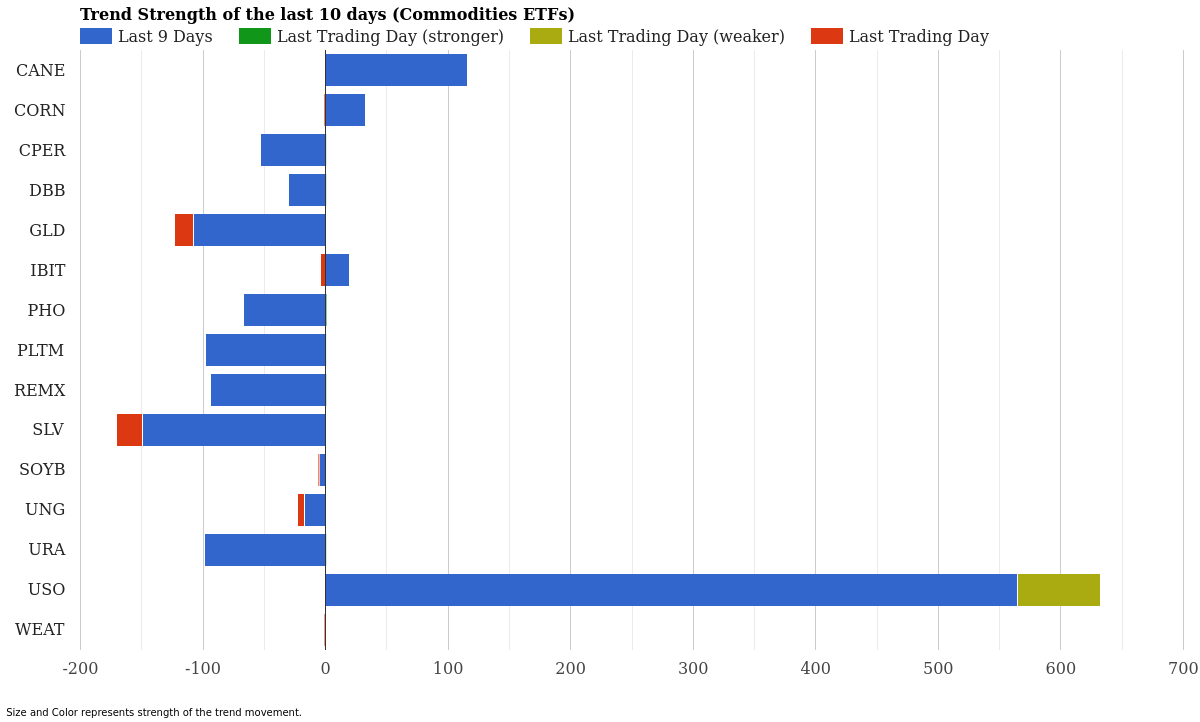
Commodity ETF Trend Strength – Last 10 Days – April 09, 2026
| Rank | ETF | 10-Day Strength | Yesterday | Signal |
|---|---|---|---|---|
| 1 | USO (Oil) | +564.64 | -67.75 | Weakening |
| 2 | CANE (Sugar) | +116.09 | -0.51 | Slowing |
| 3 | CORN | +32.91 | -1.28 | Slowing |
| 4 | IBIT (Bitcoin) | +19.60 | -3.98 | Slowing |
| 5 | WEAT (Wheat) | -0.49 | -0.53 | Downtrend |
| 6 | SOYB (Soybeans) | -5.13 | -0.94 | Downtrend |
| 7 | UNG (Natural Gas) | -17.32 | -5.63 | Downtrend |
| 8 | DBB (Metals) | -30.49 | +0.20 | Reversal |
| 9 | CPER (Copper) | -53.37 | +0.18 | Reversal |
| 10 | PHO (Water) | -66.94 | +0.69 | Reversal |
| 11 | REMX (Rare Earths) | -93.71 | +0.45 | Reversal |
| 12 | PLTM (Platinum) | -97.83 | +0.04 | Reversal |
| 13 | URA (Uranium) | -98.88 | +0.33 | Reversal |
| 14 | GLD (Gold) | -108.13 | -14.79 | Downtrend |
| 15 | SLV (Silver) | -149.65 | -21.01 | Downtrend |
Commodities paint a stark picture of divergence. USO (crude oil) commands the landscape with an extraordinary momentum score of +564.64, reflecting extraordinary energy strength over the past nine days. Yesterday’s sharp reversal -67.75 suggests profit-taking, earning it a “Weakening” signal despite remaining positive on the longer timeframe.
Agricultural commodities show mixed results. CANE (sugar) maintains a solid +116.09 with slowing momentum, while CORN at +32.91 also indicates rally fatigue. WHEAT, SOYBEANS, and NATURAL GAS all trend lower with continued downward pressure.
The most interesting development involves 6 commodity reversals: DBB (metals), CPER (copper), PHO (water resources), REMX (rare earths), PLTM (platinum), and URA (uranium) all bounced yesterday. These reversals suggest mean-reversion behavior in previously depressed commodities. However, precious metals tell a concerning story. Both GLD (gold) and SLV (silver) display deep negative momentum-especially silver at -149.65-with accelerating weakness. This suggests investors are exiting traditional safe-haven assets.
Market Context and Interpretation
The sectoral and commodity divergence reveals a market in transition. Energy’s explosive strength combined with nine sector reversals suggests a classic “risk-on” rotation away from growth and consumer names into cyclicals and value. The timing coincides with potential inflation concerns driving commodity prices higher.
Precious metals weakness is particularly telling. Gold and silver’s deterioration despite broad commodities strength implies confidence returning to risk assets. This runs counter to traditional flight-to-safety scenarios, indicating traders believe the immediate market stress is subsiding.
The reversals across industrials, financials, semiconductors, and materials ETFs suggest institutional buyers stepped in after a severe pullback. These are typically sectors that outperform during economic expansion phases, hinting at optimistic economic expectations ahead.
Consumer discretionary and staples remain under heavy pressure, which could signal either margin pressure on consumers or deliberate sector repositioning. The fact that these sectors continue declining even as broader relief emerges suggests structural challenges specific to consumer-facing businesses.
Key ETFs to Watch
Top 3 Strongest: USO dominates all commodities with +564.64 momentum, making it the market’s clear leader. XLE (Energy) sits second across all assets at +279.16. CANE (sugar) rounds out the top three at +116.09.
Critical Reversals: Watch XLB (materials), SMH (semiconductors), and XLF (financials)-these aren’t just reversals but represent typically large institutional positions. If these reversals persist and accelerate, expect capital rotation to accelerate further into value and cyclical sectors. CPER (copper) and PHO (water) merit attention as infrastructure-linked plays that could outperform in a growth recovery scenario.
Persistent Weakness: XLY (discretionary) and XLP (staples) demand caution. Their continued selling despite broader market bounces signals conviction among sellers. SLV (silver) and GLD (gold) weakness contradicts any safe-haven narrative, making precious metals a potential contrarian opportunity or a warning sign depending on your outlook.
Conclusion
April 09, 2026 captures a market in motion. While sector reversals suggest short-term bargain hunting, the persistence of consumer weakness and precious metals decline tells a nuanced story. Energy’s explosive momentum is undeniable, but whether it sustains depends on whether yesterday’s slowing represents consolidation or exhaustion.
The commodity reversals-particularly in copper, rare earths, and uranium-align with cyclical recovery narratives, but institutional money’s selective exit from gold and silver suggests measured optimism rather than panic hedging. For traders, the reversal signals offer bounce-trading opportunities, though the consumer sectors’ continued decline warrants caution on broad-based bullish positioning.
Monitor USO and XLE closely for energy momentum sustainability. Track XLB, SMH, and XLF reversals for signs of institutional rotation strength. Most importantly, watch whether XLY and XLP stabilize-their continued weakness could signal economic headwinds beneath the surface.
Disclaimer: This analysis is based on momentum scoring data and should not be considered financial advice. ETF performance is subject to market volatility, and past momentum does not guarantee future results. All momentum scores reflect data from the trading session of April 08, 2026. Investors should conduct their own research and consult with qualified financial advisors before making trading decisions. StockBotty does not provide personalized investment recommendations.
Author Disclosure: The author may hold or has held positions in ETF-related instruments directly or through derivative constructs at the time of publication. This is not a trading recommendation. All analysis is provided for informational purposes only. Readers must conduct independent analysis and risk assessment before trading.
For more market analysis visit stockbotty.com | Disclaimer: stockbotty.com/disclaimer
—
More Momentum & Strength Articles
SHLD, GDX Lead as Utilities Plunge – Momentum August 22
Cybersecurity Climbs as Utilities Fade - August 22, 2026 Executive Summary Sector momentum shows ...
Aug 22, 2026Financials Lead, Utilities Collapse – August 21, 2026
Financials Lead as Utilities Collapse - August 21, 2026 Executive Summary Capital is rotating har...
Aug 21, 2026Commodities Lead as Sectors Fade – Momentum Rankings August 20
Commodities Surge as Tech Retreats - August 20, 2026 Executive Summary Commodity ETFs are command...
Aug 20, 2026Financials Lead as Utilities Collapse – August 19, 2026
Financials Lead as Utilities Slide - August 19, 2026 Capital is flowing into established financia...
Aug 19, 2026Financials Lead, Biotech Flips – ETF Momentum August 18
Financials Lead as Biotech Stalls - August 18, 2026 Executive Summary XLF (Financials) dominates ...
Aug 18, 2026