
VIX Volatility Report – March 20, 2026: Elevated Fear Easing as Market Stabilizes
Executive Summary
The VIX closed at 24.06 on March 19, 2026, declining 1.03 points (-4.11%) from the previous day and falling 3.13 points (-11.51%) over the past five trading days. This elevated volatility reading sits 4.61 points above the two-year mean of 19.45, yet the downward trend signals improving market sentiment. The term structure reveals a normal contango pattern, suggesting gradual normalization of fear as near-term uncertainty subsides.
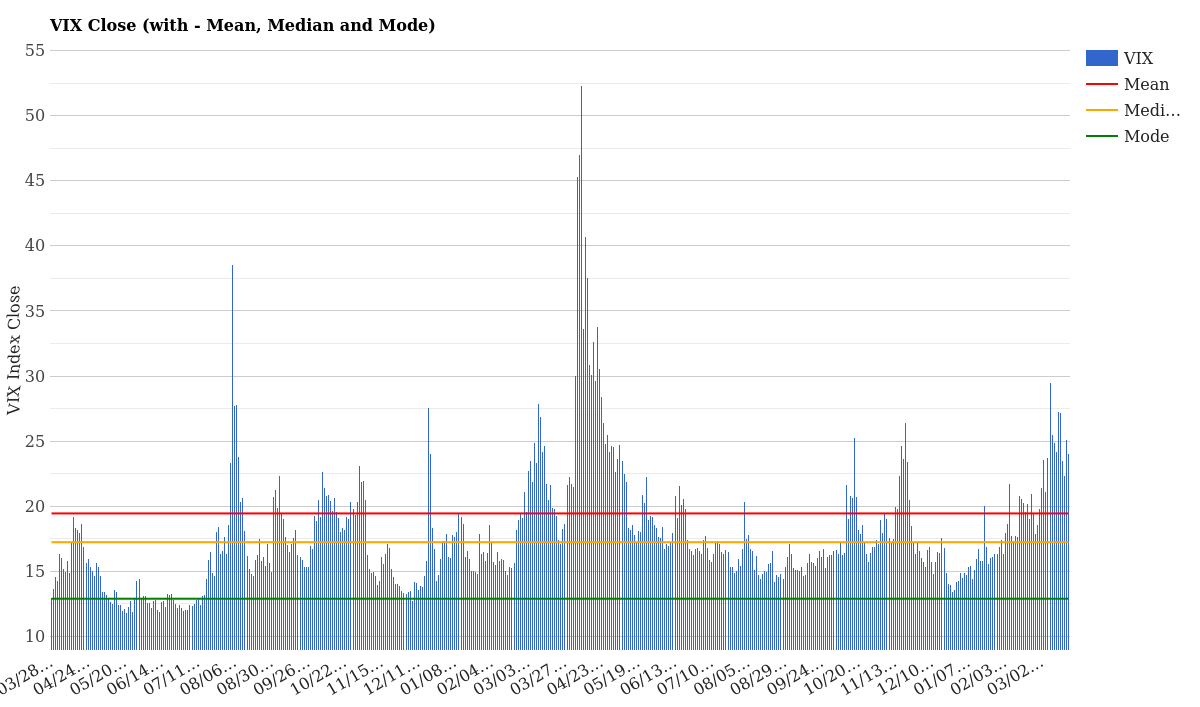
VIX Close with Mean, Median and Mode – March 20, 2026
Current VIX Status
| Metric | Value | Historical Reference | Assessment |
|---|---|---|---|
| VIX Close (03/19/26) | 24.06 | 2-Year Mean: 19.45 | Elevated but calming |
| Daily Change | -1.03 (-4.11%) | Prior: 25.09 | Positive momentum |
| 5-Day Change | -3.13 (-11.51%) | 5-Day High: 27.29 | Clear downtrend |
| vs 2-Year Mean | +4.61 | Mean: 19.45 | Still above normal |
| vs 2-Year Median | +6.82 | Median: 17.24 | Notably elevated |
| 1-Year Percentile | 67.1% | Range: 11.99 – 52.33 | Upper-middle volatility days |
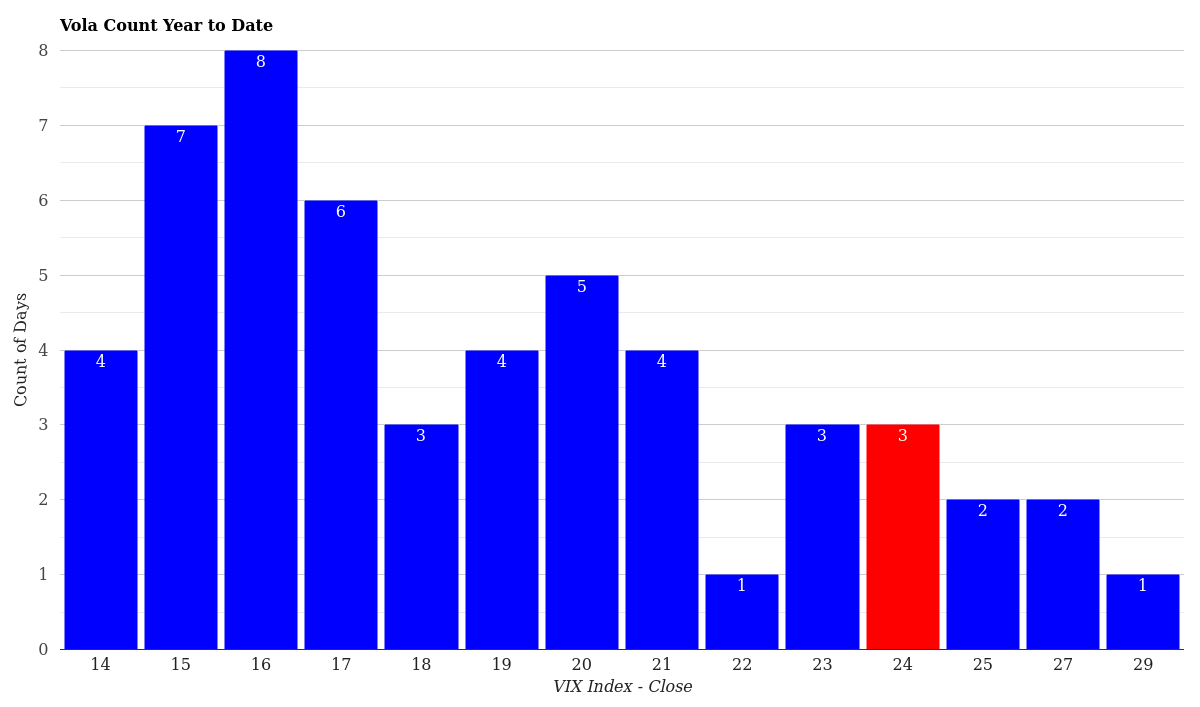
| YTD Percentile | 100.0% | 2026 High: 29.49 | Very elevated for the year |
| Volatility Status | ELEVATED | Above Mean, Declining | Transition phase |
VIX Term Structure Analysis
Understanding the VIX term structure reveals market expectations about future volatility. When near-term VIX measures (like VIX9D) sit below longer-dated ones (VIX3M, VIX6M), we see what traders call “contango” – a sign of normalized, healthy markets. Conversely, when short-term measures exceed long-term ones, we get “backwardation,” which signals acute near-term fear.
| Measure | 03/19/26 | 03/18/26 | 03/17/26 | 03/16/26 | 03/13/26 |
|---|---|---|---|---|---|
| VIX9D | 24.09 | 26.03 | 22.36 | 24.33 | 28.00 |
| VIX (Spot) | 24.06 | 25.09 | 22.37 | 23.51 | 27.19 |
| VIX3M | 25.54 | 26.56 | 24.33 | 24.92 | 27.28 |
| VIX6M | 26.44 | 27.20 | 25.28 | 25.63 | 27.43 |
| VIX1Y | 26.23 | 26.48 | 25.43 | 25.63 | 26.75 |
Today’s curve displays classic contango: VIX9D at 24.09 sits below VIX1Y at 26.23, with a measured slope upward. This 2.14-point spread between nine-day and one-year measures represents a return to orderly market pricing. Just five days ago on March 13, the curve showed far steeper anxiety, with the 9D measure at 28.00 – nearly a full point higher than VIX1Y.
Contango structures favor calm market participants. Options sellers find opportunity in this environment, while option buyers face higher premiums but gain protection against potential near-term flare-ups. The gradual decline across all term points suggests market participants are pricing out acute near-term shocks and settling into a more measured assessment of forward risk.
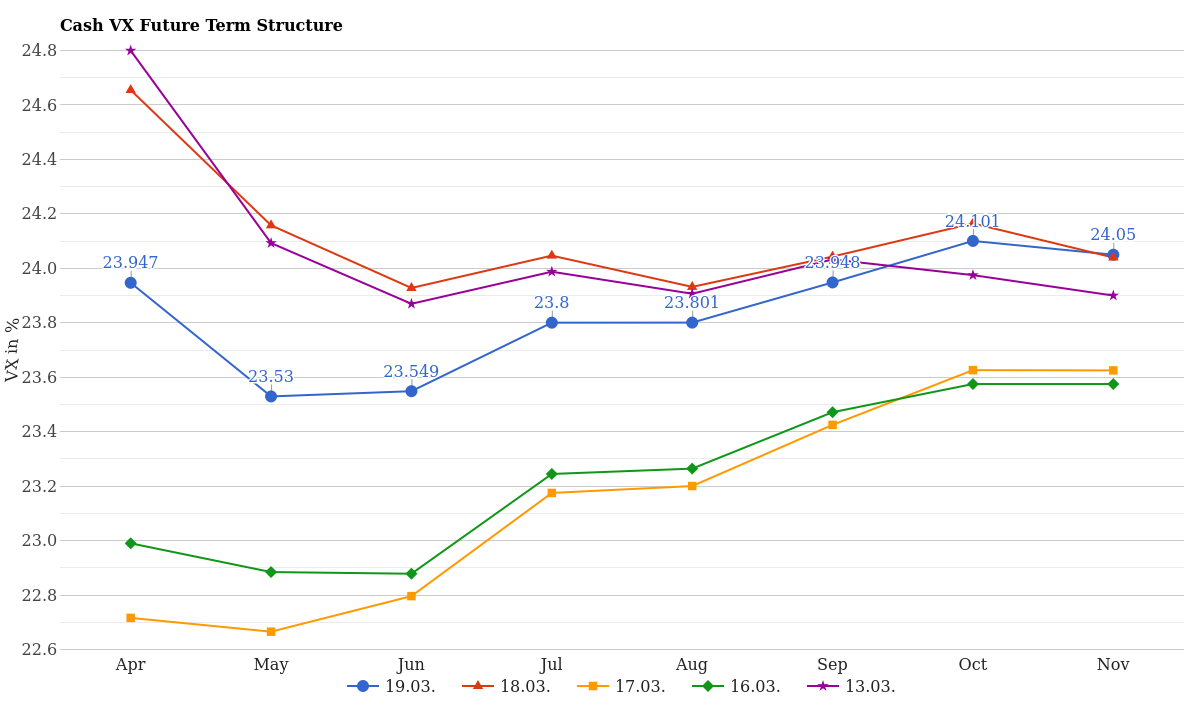
VIX Future Term Structure (VIX9D to VIX1Y) – Last 5 Days
Cash VX Futures Curve
The cash VIX futures curve, which shows implied volatility expectations for each calendar month, provides deeper insight into forward expectations. Here’s how settlement prices evolved:
| Month | 03/19/26 | 03/18/26 | 03/17/26 | 03/16/26 | 03/13/26 |
|---|---|---|---|---|---|
| April | 23.95 | 24.65 | 22.72 | 22.99 | 24.80 |
| May | 23.53 | 24.16 | 22.67 | 22.88 | 24.09 |
| June | 23.55 | 23.93 | 22.80 | 22.88 | 23.87 |
| July | 23.80 | 24.05 | 23.18 | 23.24 | 23.99 |
| August | 23.80 | 23.93 | 23.20 | 23.26 | 23.91 |
| September | 23.95 | 24.04 | 23.43 | 23.47 | 24.03 |
| October | 24.10 | 24.17 | 23.63 | 23.58 | 23.98 |
| November | 24.05 | 24.04 | 23.63 | 23.58 | 23.90 |
Across the entire calendar, futures prices have compressed significantly. Five days ago, April futures stood at 24.80; today they’re 23.95. This 0.85-point decline mirrors the recovery in broader market sentiment. The flattening across months-with most settling between 23.50 and 24.10-suggests market-makers no longer expect cascading fear into the summer months.
What traders should note: April remains slightly elevated, hinting that immediate catalysts still command attention. Yet November, typically a calmer month historically, sits at the same level. This equilibrium reflects uncertainty that near-term turbulence will fade without fresh shocks.
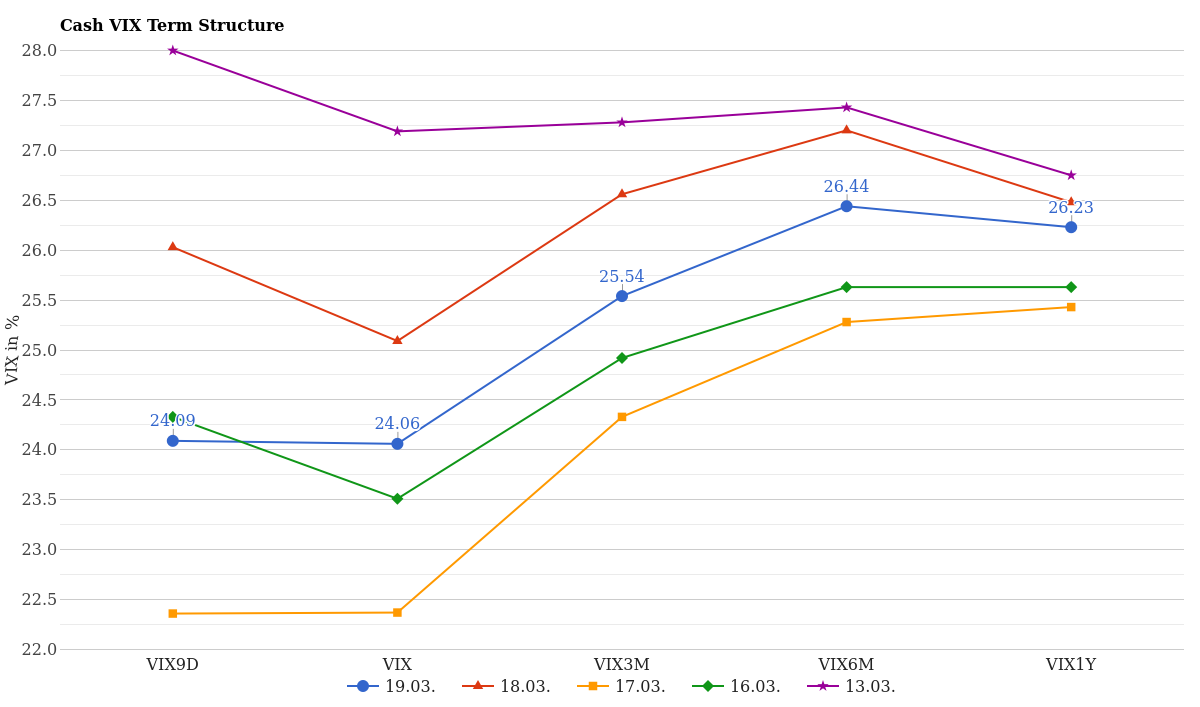
Cash VIX Future Term Structure – Last 5 Days
Historical Volatility Context: 1-Year Distribution
Over the past twelve months, how often have we seen VIX readings near today’s 24.06 level? Here’s the one-year distribution:
| VIX Level | Days | Frequency | Note |
|---|---|---|---|
| 13-15 | 59 | 14.7% | Low volatility |
| 16-19 | 113 | 28.3% | Below mean zone |
| 20-23 | 64 | 16.0% | Moderate elevation |
| 24 *TODAY* | 9 | 2.3% | Uncommon |
| 25-30 | 27 | 6.8% | High elevation |
| 31+ | 128 | 32.0% | Crisis-level events |
Today’s 24.06 reading ranks in the upper quartile but remains below the crisis threshold of 31+. Over the past year, we’ve spent 32% of days in extreme volatility (VIX 31+), notably higher than the typical two-year average. The 2.3% frequency at VIX 24 underscores how exceptional this reads relative to normal market breathing. Only 9 days out of 400 have landed precisely in this band.
Comparing year-to-date data, March 2026 has been significantly more turbulent than average. The YTD percentile of 100% means every trading day so far has seen volatility in the upper range. This reflects genuine market stress in early 2026 – whether driven by monetary policy uncertainty, geopolitical events, or earnings surprises remains less important than recognizing that calm conditions have not yet returned.
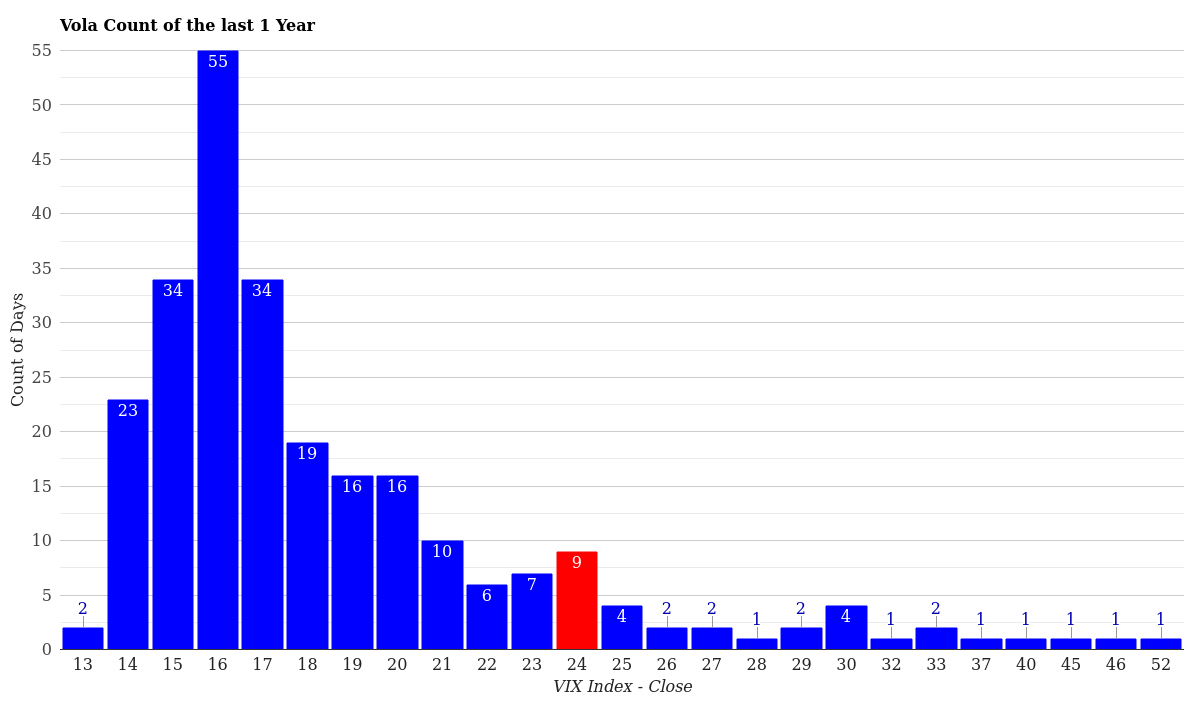
VIX Volatility Distribution – Last 12 Months
VIX Volatility Distribution – Year to Date
What This Means for Traders
Option Pricing & Implied Volatility
At 24.06, option premiums remain elevated. Call and put prices reflect this high implied volatility, making both protective puts and covered call strategies more expensive than they would be in calm markets. Long-dated options benefit most from this environment-traders selling premium find rich compensation, while those buying volatility pay significant costs.
The contango structure favors volatility sellers over the next three months. Calendar spreads, short straddles, and iron condors offer attractive risk-reward ratios because longer-dated volatility exceeds near-term measures, creating natural decay tailwinds for short positions.
Index and Equity Implications
A VIX at 24 historically corresponds to equity indices trading with 15-25% annualized volatility. Stock price swings of 1-3% per day become commonplace. Large-cap indices typically absorb this; smaller stocks and growth names face sharper drawdowns. Hedging becomes economical at these levels-not expensive insurance, but reasonable protection.
Key Support & Resistance Levels
Monitor these VIX thresholds closely:
- Median (17.24): If VIX falls here, it signals genuine normalization and a shift toward complacency.
- Mean (19.45): The two-year average; rates below here begin favoring equity accumulation strategies.
- Current (24.06): Elevated but stable. Moves above 27 suggest renewed panic; breaks below 21 imply fading fear.
- 25: Traditional threshold separating “elevated” from “high” volatility; often acts as resistance.
- 30: Historical danger zone where equity hedges activate and forced selling begins.
Conclusion
The VIX at 24.06 on March 20, 2026, reflects an intermediate state: elevated but improving. Down 11.51% over five days, the market signal is clear-acute fear is subsiding. The contango term structure suggests gradual normalization without panic. Yet with volatility still 4.61 points above the two-year mean, complacency remains premature.
Traders should watch for a close below 22 as confirmation that calm is truly returning. Until then, maintain discipline around risk management. Options premium remains elevated enough to justify income strategies, while hedges remain reasonably priced for those seeking downside protection. The next major catalyst will likely reset this entire picture-stay vigilant.
This article is for informational purposes only and does not constitute financial or investment advice. All data is historical and statistical. Past performance is not indicative of future results. The VIX is a complex instrument; volatility patterns can shift unexpectedly. Always consult a qualified financial advisor before making trading decisions. StockBotty and its contributors assume no liability for trading losses resulting from the use of this report.
The author may hold or has held positions in VIX-related instruments, derivatives, or volatility exchange-traded products at the time of publication. This report is analytical commentary, not a trading recommendation. Past holdings do not guarantee accuracy of forward-looking statements.
For more market analysis visit stockbotty.com | Disclaimer: stockbotty.com/disclaimer