
VIX Volatility Report – March 19, 2026: Sharp Spike to 25.09 Signals Rising Market Stress
Executive Summary
The VIX jumped 2.72 points (12.16%) to close at 25.09 on March 18, 2026, marking a significant uptick in market volatility. This level sits 5.64 points above the two-year mean of 19.45 and 7.85 points above the median of 17.24, placing current volatility in the elevated stress zone. The one-year percentile reading of 71.0% indicates that today’s closing falls in the upper quartile of volatility days over the past 12 months. Year-to-date, the VIX is trading at its absolute peak (100th percentile), suggesting material economic or geopolitical concerns are driving risk-off sentiment across equity markets.
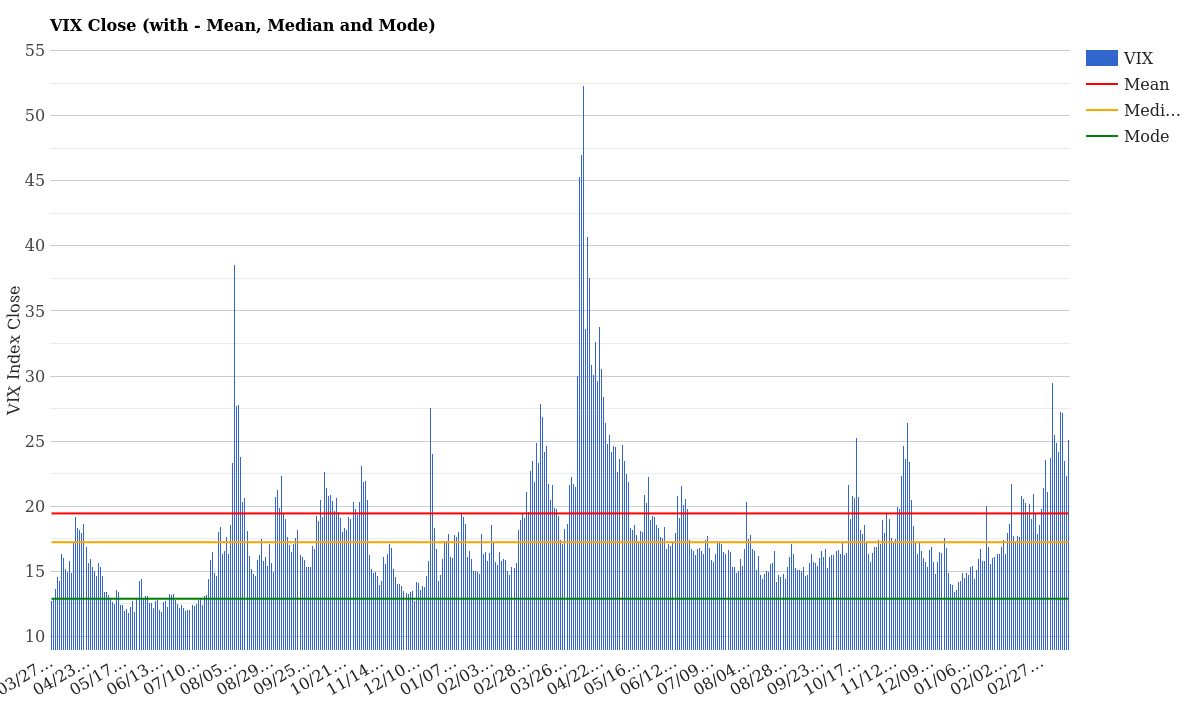
VIX Close with Mean, Median and Mode – March 19, 2026
Current VIX Status
| Metric | Value | Historical Reference | Assessment |
|---|---|---|---|
| VIX Today (03/18/26) | 25.09 | 2Y Mean: 19.45 | Elevated risk-off |
| Daily Change | +2.72 (+12.16%) | Prior: 22.37 | Sharp single-day spike |
| 5-Day Change | -2.20 (-8.06%) | 03/13: 27.19 | Declining from recent highs |
| vs 2-Year Mean | +5.64 | 19.45 baseline | Well above normal |
| vs 2-Year Median | +7.85 | 17.24 midpoint | Significantly elevated |
| 1-Year Percentile | 71.0% | Upper quartile range | Volatile but not extreme |
| YTD Percentile | 100.0% | Highest of 2026 | Peak year-to-date level |
| Volatility Status | HIGH – STRESS | Above 25 threshold | Risk-off environment |
VIX Term Structure Analysis
The VIX term structure reveals critical information about market expectations for near-term versus longer-term volatility. Today’s curve shows a contango structure, which is the normal state during calmer periods. Contango means that forward VIX contracts (VIX3M, VIX6M, VIX1Y) are trading at higher levels than the spot VIX (VIX9D and VIX), suggesting the market expects volatility to persist but anticipates a gradual normalization over the next 12 months.
| Contract | 03/18 | 03/17 | 03/16 | 03/13 | 03/12 |
|---|---|---|---|---|---|
| VIX9D | 26.03 | 22.36 | 24.33 | 28.00 | 28.98 |
| VIX (Spot) | 25.09 | 22.37 | 23.51 | 27.19 | 27.29 |
| VIX3M | 26.56 | 24.33 | 24.92 | 27.28 | 26.95 |
| VIX6M | 27.20 | 25.28 | 25.63 | 27.43 | 27.26 |
| VIX1Y | 26.48 | 25.43 | 25.63 | 26.75 | 26.24 |
Term Structure Interpretation: The contango curve reveals that longer-dated volatility expectations (6-month and 1-year contracts) are elevated relative to near-term readings. This suggests market participants believe current stress is temporary and expect mean reversion toward the 19-20 range over the coming months. The modest spread between VIX3M (26.56) and VIX1Y (26.48) indicates that volatility is expected to remain sticky through mid-2026, with only gradual improvement anticipated by year-end.
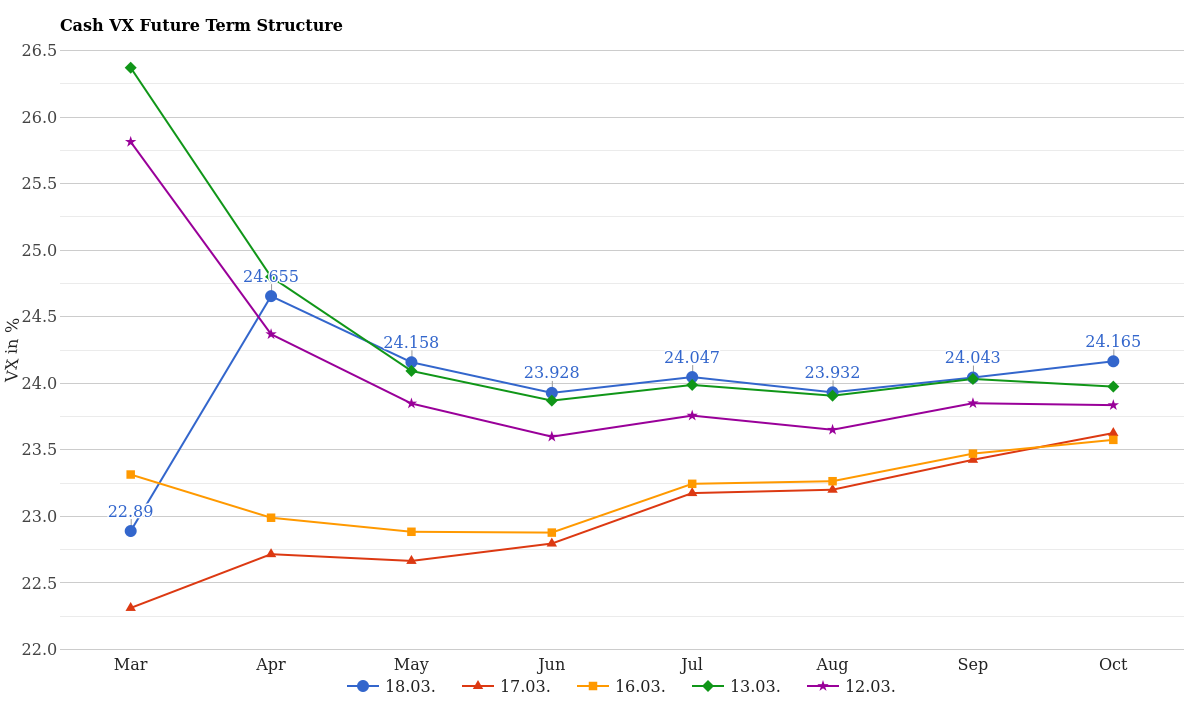
VIX Future Term Structure (VIX9D to VIX1Y) – Last 5 Days
Cash VX Futures Curve Analysis
The cash VIX futures curve provides a month-by-month roadmap of expected volatility expiration by expiration. The most recent five trading days reveal a consistent contango structure with modest month-over-month increases, reflecting underlying market uncertainty about macroeconomic headwinds.
| Expiry | 03/18 | 03/17 | 03/16 | 03/13 | 03/12 |
|---|---|---|---|---|---|
| March | 22.89 | 22.31 | 23.31 | 26.37 | 25.81 |
| April | 24.65 | 22.72 | 22.99 | 24.80 | 24.37 |
| May | 24.16 | 22.67 | 22.88 | 24.09 | 23.85 |
| June | 23.93 | 22.80 | 22.88 | 23.87 | 23.60 |
| July | 24.05 | 23.18 | 23.24 | 23.99 | 23.76 |
| August | 23.93 | 23.20 | 23.26 | 23.91 | 23.65 |
| September | 24.04 | 23.43 | 23.47 | 24.03 | 23.85 |
| October | 24.17 | 23.63 | 23.58 | 23.98 | 23.84 |
5-Day Trend Analysis: The cash VIX curve has been volatile over the past week, with the March contract widening from 22.31 on March 17 to 22.89 today, while mid-term contracts (April through October) have stabilized in the 23.93-24.65 range. This suggests that near-term expiries are being repriced higher as immediate uncertainty increases, but the market expects a normalization as we move into spring. The lack of dramatic increases in the June-October contracts indicates that traders do not anticipate sustained elevated volatility beyond Q2 2026.
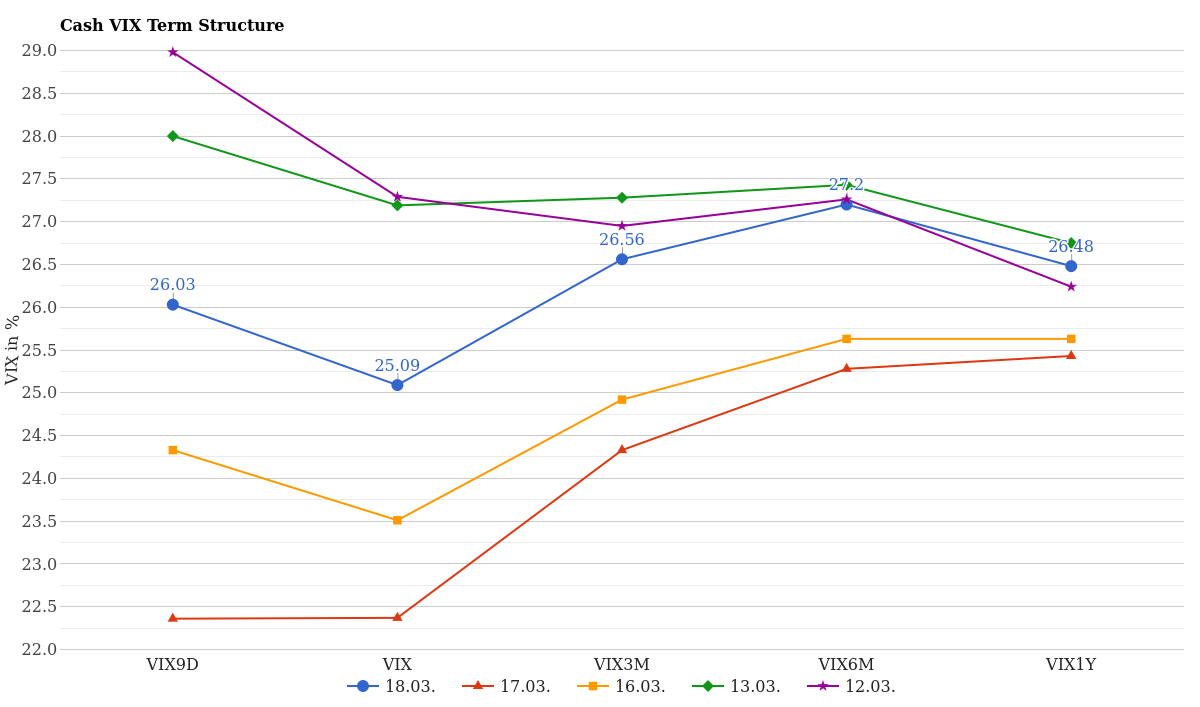
Cash VIX Future Term Structure – Last 5 Days
Historical Volatility Context
One-Year Volatility Distribution (Last 12 Months)
| VIX Level | Days Observed | % of Trading Days | Distribution |
|---|---|---|---|
| 13-14 | 25 | 9.2% | Low volatility baseline |
| 15-16 | 89 | 32.7% | Most common range |
| 17-18 | 53 | 19.5% | Median zone |
| 19-20 | 26 | 9.6% | Mean zone |
| 21-24 | 28 | 10.3% | Elevated volatility |
| 25+ | 22 | 8.1% | Stress zone (TODAY) |
| 26-30 | 11 | 4.0% | Crisis range |
| 31+ | 8 | 2.9% | Panic levels |
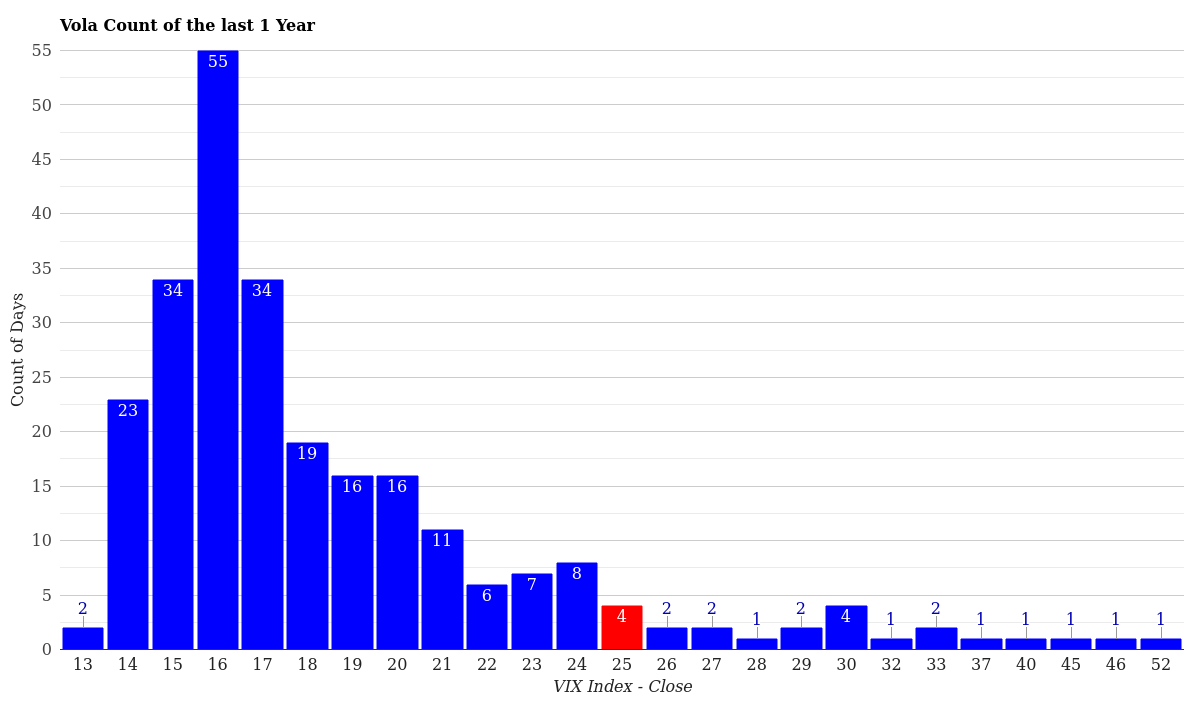
VIX Volatility Distribution – Last 12 Months
1-Year vs Year-to-Date Comparison: Today’s VIX reading of 25.09 places it in the stress zone (25+), which has occurred on only 22 days in the past 12 months (8.1% of trading days). This level is uncommon but not unprecedented. However, year-to-date, the VIX has spent a disproportionate amount of time in elevated ranges. The YTD percentile reading of 100.0% means that March 18, 2026 represents the highest volatility day of the entire year. This suggests that Q1 2026 has been characterized by unusually elevated risk aversion compared to the calmer backdrop of late 2025. The volatility spike into the 25-30 range (6 days YTD vs 11 days in the full 12-month period) indicates that market stress is intensifying rather than normalizing.
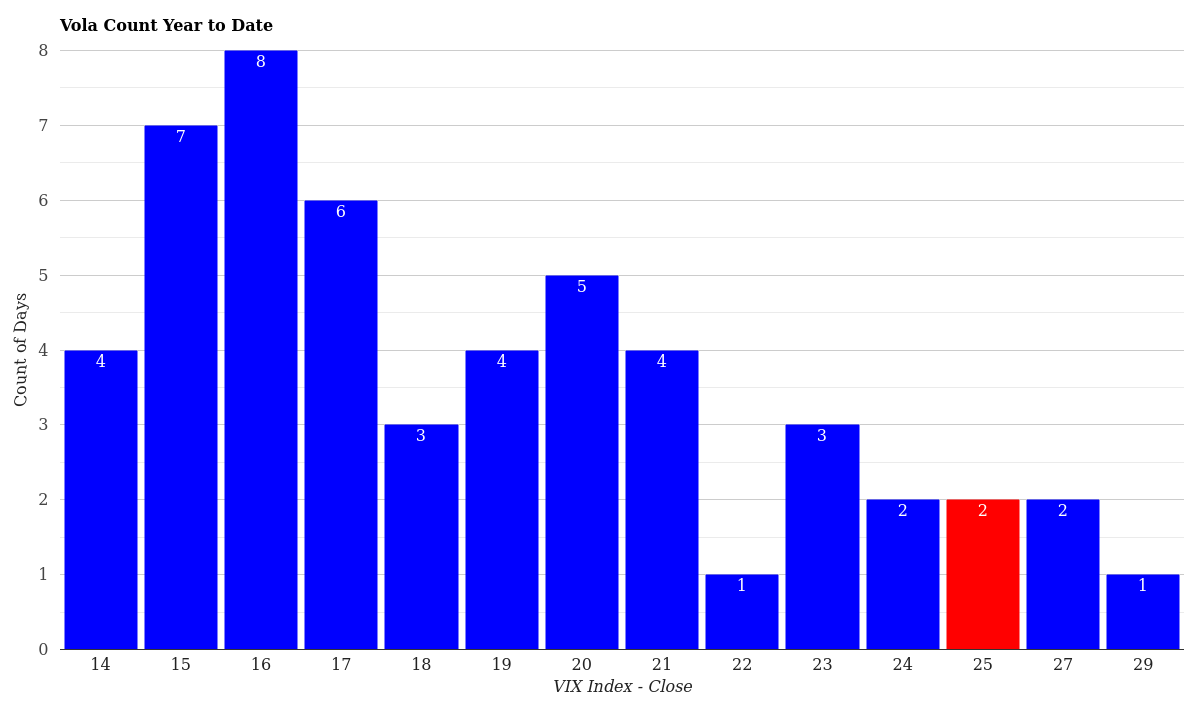
VIX Volatility Distribution – Year to Date
What This Means for Traders
Immediate Market Implications: A VIX at 25.09 signals that equity market participants are pricing in meaningful uncertainty. At this level, portfolio hedging costs are elevated, making protective put options more expensive. Implied volatility across the S&P 500 options chain is likely near 22-28% annualized, depending on moneyness and tenor. Option spreads widen, bid-ask spreads increase, and market impact costs rise for large trades.
Options Pricing Dynamics: The current contango term structure means that long-dated options are relatively more expensive than near-term options. Traders selling volatility would find better premium collection in the front-month contracts (March), while those buying volatility for protection should consider rolling into April or May contracts where time decay is slower. The normal contango suggests the market views the current spike as temporary, which should theoretically favor volatility sellers on strength, though the elevated absolute level counsels caution.
Key VIX Levels to Monitor:
- 17.24 (2Y Median): The historical midpoint. A move back below this level would suggest a return to calm conditions. Currently +7.85 away.
- 19.45 (2Y Mean): The long-term average. Breaking below this would confirm mean reversion is underway. Currently +5.64 away.
- 20-22 Zone: A reasonable target for containment if the current stress event resolves. Currently +3-5 away.
- 25 (Current Level): The stress threshold. Sustained trading above 25 justifies elevated hedging costs and supports buy-the-dip mentality on equities.
- 30+: Crisis territory. A spike above 30 would suggest panic selling and warrant tactical defensive positioning.
Conclusion
The VIX closed March 18, 2026 at 25.09, up 2.72 points and trading at its highest level year-to-date. This represents elevated but not extreme volatility, placing today’s reading at the 71st percentile of the past 12 months. The normal contango term structure indicates the market expects a gradual return to calm, with longer-dated contracts pricing in mean reversion by Q3-Q4 2026. Traders should remain alert to further spikes toward the 27-30 range, which could indicate accelerating stress, but the present technical setup suggests the current move is likely a contained correction rather than the onset of a sustained volatility regime.
The key takeaway: Markets are nervous but not panicked. Hedging is warranted, but scale into positions rather than going all-in on bets that the VIX will collapse immediately. Mean reversion is likely, but the path to lower volatility levels may be choppy.
DISCLAIMER
This article is for informational purposes only and does not constitute financial or investment advice. All data is historical and statistical in nature. Past performance is not indicative of future results. The VIX Index is a complex instrument, and volatility can change rapidly based on market conditions, geopolitical events, and macroeconomic data. Investors should consult a qualified financial advisor before making trading decisions based on volatility analysis.
AUTHOR DISCLOSURE
The author may hold positions in VIX-related instruments, volatility derivatives, or equity index positions directly or through derivative constructs at the time of publication. This report is generated for analytical and educational purposes. Readers should be aware that volatility trading carries substantial risk and is not suitable for all investors. Past statements in volatility forecasting do not guarantee accuracy of future predictions.
For more market analysis visit stockbotty.com | Disclaimer: stockbotty.com/disclaimer