
VIX at 26.78: Markets Shift Into Higher Stress Territory
The VIX currently stands at 26.78, up 11.31% from yesterday’s close and marking a significant move into the elevated volatility zone. This reading tells us that market participants are pricing in considerably more uncertainty than we saw just one week ago. In this report, we’ll break down what this level means for different types of traders, examine the term structure of fear, and explore how rare this particular level is in historical context.
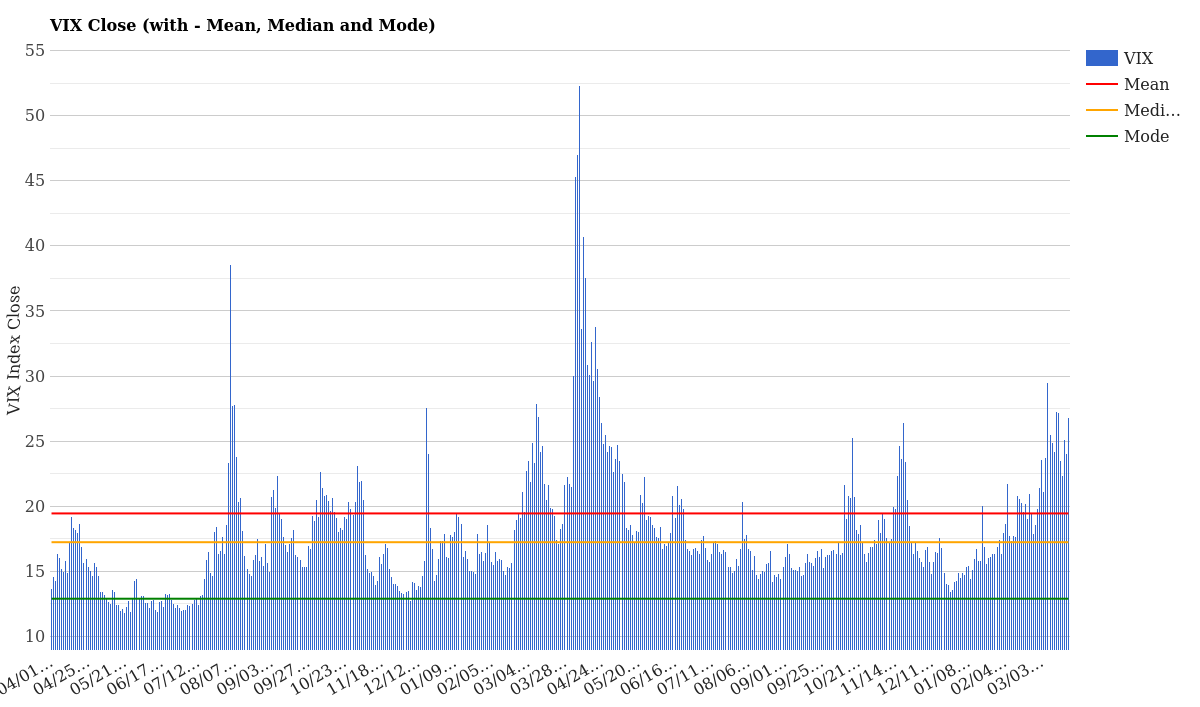
VIX Close with Mean, Median and Mode – March 23, 2026
What the Current VIX Level Means
At 26.78, the VIX sits well above its two-year mean of 19.45 and significantly above its median of 17.24. To put this in perspective, today’s reading is 7.33 points higher than the average and 9.54 points above the median-a substantial deviation that warrants attention from anyone with market exposure.
| Metric | Value | Assessment |
|---|---|---|
| VIX Current Close | 26.78 | Elevated |
| Daily Change | +2.72 (+11.31%) | Sharp Spike |
| 5-Day Change | +3.27 (+13.91%) | Strengthening Trend |
| vs 2-Year Mean | +7.33 | Well Above Average |
| vs 2-Year Median | +9.54 | Significantly Elevated |
| 1-Year Percentile | 75.4th | Top Quarter of Readings |
| Year-to-Date Percentile | 100.0th | Highest 2026 Reading |
This is not panic-level territory-those readings typically occur above 35-but we’ve clearly transitioned from calm to cautious. The fact that today represents the highest VIX close of 2026 so far is particularly noteworthy. When the year’s peak volatility hits, it usually signals a meaningful shift in market sentiment rather than a temporary blip.
For equity traders, a VIX in the upper 20s typically coincides with stock market pullbacks of 5-10%. Options traders will notice that implied volatility is pricing in substantially larger expected price swings in the coming weeks. Fixed income investors may see some repricing as risk premiums expand.
VIX Term Structure: Short-Term vs Long-Term Fear
One of the most useful insights from the VIX comes from looking at the term structure-essentially, how fear is distributed across different time horizons. Today’s curve tells an interesting story about market expectations.
| Contract | Timeframe | Today’s Level | vs Yesterday |
|---|---|---|---|
| VIX9D | Next 9 Days | 26.95 | +2.86 |
| VIX | Spot/Current | 26.78 | +2.72 |
| VIX3M | 3 Months Out | 27.43 | +1.88 |
| VIX6M | 6 Months Out | 28.35 | +1.91 |
| VIX1Y | 12 Months Out | 26.84 | +0.61 |
The term structure today shows contango-a normal market structure where longer-dated volatility is higher than near-term volatility. This is actually a good sign: it suggests that markets expect near-term turbulence to settle down as we move further into the future. The VIX6M reading of 28.35 peaks the curve, with the one-year contract dropping back down to 26.84.
This pattern indicates the market is pricing in uncertainty over the next few months but believes stability will gradually return. If we were seeing severe backwardation (short-term rates much higher than long-term), it would suggest panic and imminent danger. Instead, the current structure suggests contained stress with an expectation of normalization.
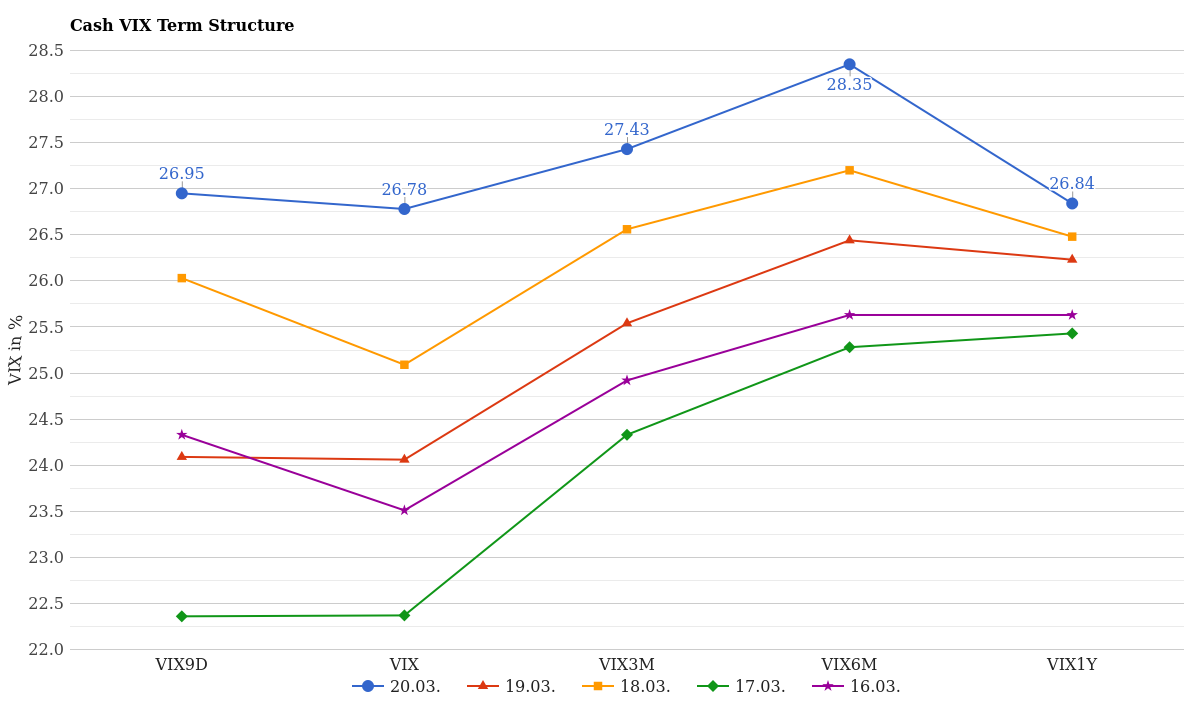
Cash VIX Term Structure – Last 5 Days
How Volatility Has Changed This Week
Looking at the five-day period ending March 20, we can clearly see an acceleration in volatility. The chart below shows the cash VIX index across the April, May, and June contracts, and the trend is unmistakably upward.
| Expiration | March 20 (Today) | March 19 | March 16 | 5-Day Change |
|---|---|---|---|---|
| April | 25.75 | 23.95 | 22.99 | +2.76 |
| May | 24.75 | 23.53 | 22.88 | +1.87 |
| June | 24.37 | 23.55 | 22.88 | +1.49 |
| July | 24.45 | 23.80 | 23.24 | +1.21 |
Every single contract month is higher than it was five trading days ago. The April contract-closest to expiration-shows the most dramatic move, up 2.76 points. This concentrated fear in the nearest month is exactly what you’d expect when something has spooked the market in the immediate term.
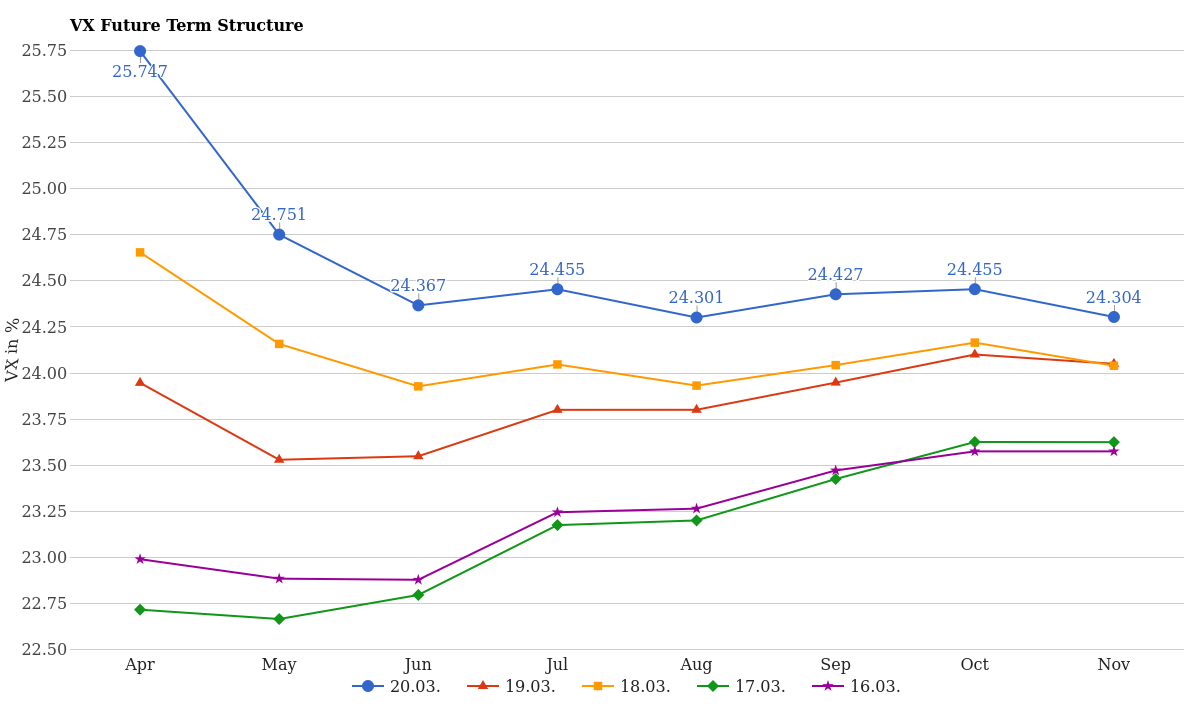
VIX Future Term Structure – Last 5 Days
How Rare Is This VIX Level Historically?
One way to understand whether a volatility reading is truly exceptional is to look at how often we see similar levels. Over the past year, a VIX reading of 26.78 sits at the 75th percentile, meaning only about one-quarter of trading days saw higher volatility. Year-to-date in 2026, it’s the absolute highest reading we’ve seen.
The one-year distribution reveals that readings in the mid-20s are not uncommon-we’ve seen 55 instances of VIX readings at 16, and the mode (most frequent reading) clusters around 12-17. But stepping into the 26+ range puts us firmly in elevated territory. The 1-year chart shows this clearly with the dramatic reduction in frequency as we climb into the high 20s and beyond.
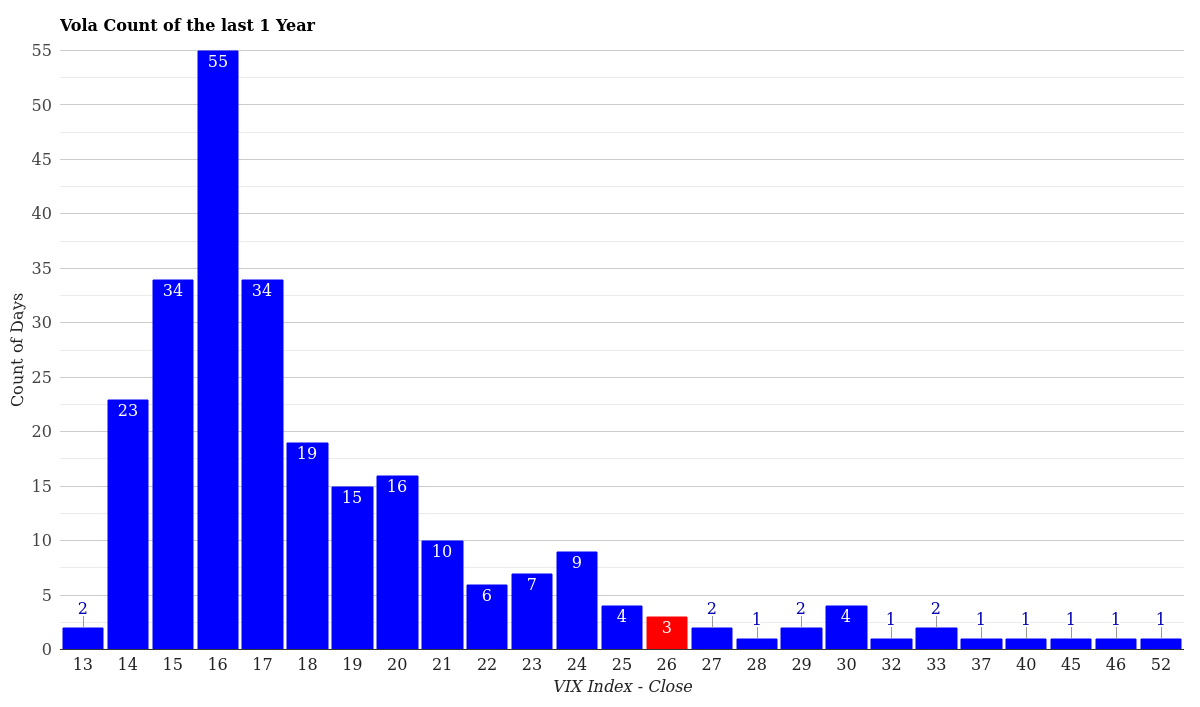
VIX Volatility Distribution – Last 12 Months
Year-to-date, we have far fewer data points, but the pattern is stark. Every reading today represents the highest volatility print of the year. In January and February, most trading days clustered in the mid-to-high teens. The jump to the high 20s in mid-March marks a material shift in market conditions.
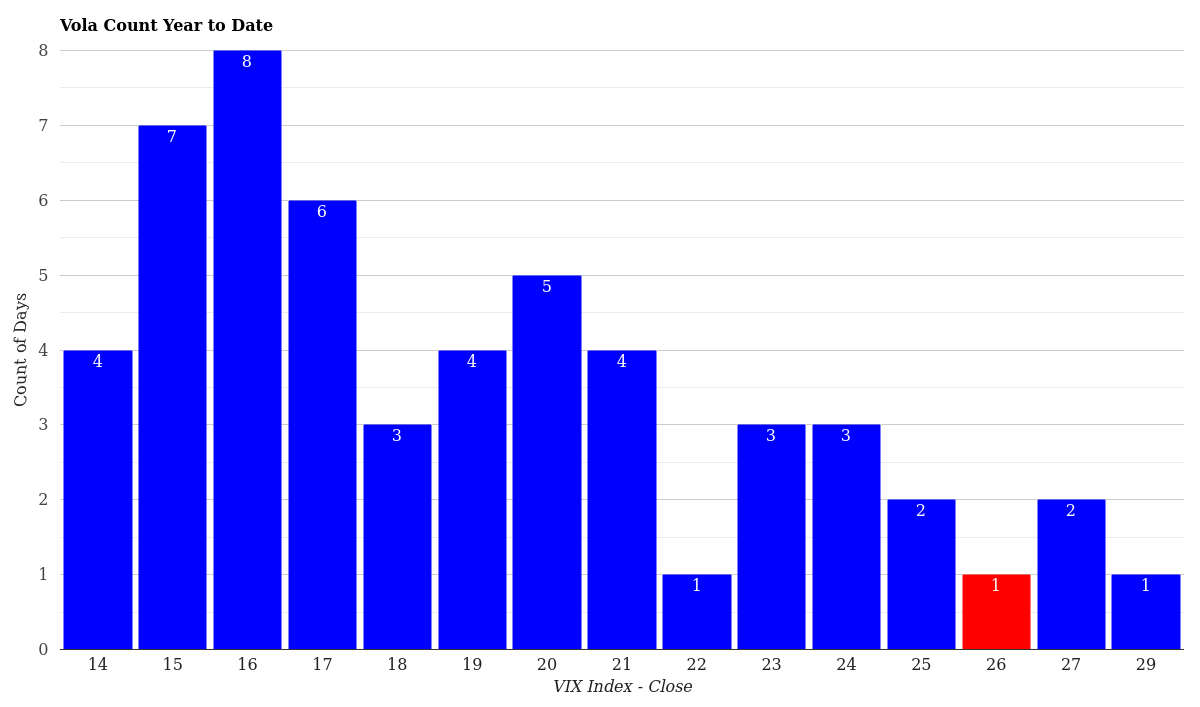
VIX Volatility Distribution – Year to Date
What This Means for Traders Right Now
For equity traders, a VIX at 26.78 suggests meaningful downside pressure may be present or expected. Historical analysis shows that when the VIX reaches levels above 25, the S&P 500 is typically correcting or has already experienced a 5-7% pullback. If you’re long equities, this is a red flag to either tighten stops or take some profits.
For options traders, this environment is gift-wrapped in opportunity. Implied volatility levels are elevated, which means premium is rich on both sides-great for selling if you’re confident, and also pricy if you need to buy protection. The contango structure in the term curve suggests that buying longer-dated puts (further out the curve) may be more economical than buying front-month protection.
For volatility traders, the key levels to monitor are the resistance at 28.35 (the 6-month contract level) and support around 24-25 (closer to normal readings). A break above 28 would suggest further deterioration in sentiment. A close back below 24 would signal relief and potential mean reversion toward the 19-20 range.
For strategic investors, elevated VIX readings often create compelling entry points into quality assets that have been oversold. However, resist the urge to catch a falling knife. Wait for some signs that the selling pressure is actually abating before adding new positions.
Conclusion & Market Outlook
The VIX at 26.78 represents a clear transition from calm to cautious. This is the highest reading of 2026, a five-day climb of 13.91%, and a positioning that sits in the top quartile of historical readings. The term structure suggests near-term turbulence with expectations of stabilization further out, which is actually the healthiest possible version of elevated volatility.
The immediate question is whether this spike continues or begins to reverse. Current technical levels suggest 28-29 would represent a hard ceiling for fear in the near term, while a drop back below 24 would signal real relief. Watch for economic data, Fed commentary, and corporate earnings guidance over the coming days-these typically act as the catalysts that either confirm elevated fear or allow it to dissipate.
For anyone with market exposure, the current environment warrants a reassessment of risk tolerance and portfolio positioning. A 26.78 VIX is not a crisis signal, but it is absolutely a signal to stay sharp and avoid complacency. Keep position sizes proportionate to your risk capacity and have your exit plans clearly defined.
For more market analysis visit stockbotty.com | Disclaimer: stockbotty.com/disclaimer