
VIX Volatility Report – March 18, 2026: Elevated Volatility Easing as Market Stabilizes
Executive Summary: The VIX closed at 22.37 on March 17, 2026, down 1.14 points (-4.85%) from the previous session and declining 1.86 points (-7.68%) over the past five trading days. Current volatility remains elevated above the two-year mean of 19.45, sitting at the 63.2nd percentile of the past year, indicating that roughly three-in-five trading days saw lower volatility levels. The term structure displays a normal contango pattern, suggesting the market is pricing in a gradual return to calmer conditions. Year-to-date, today’s reading ranks at the 100th percentile, reflecting the volatile nature of Q1 2026 market conditions.
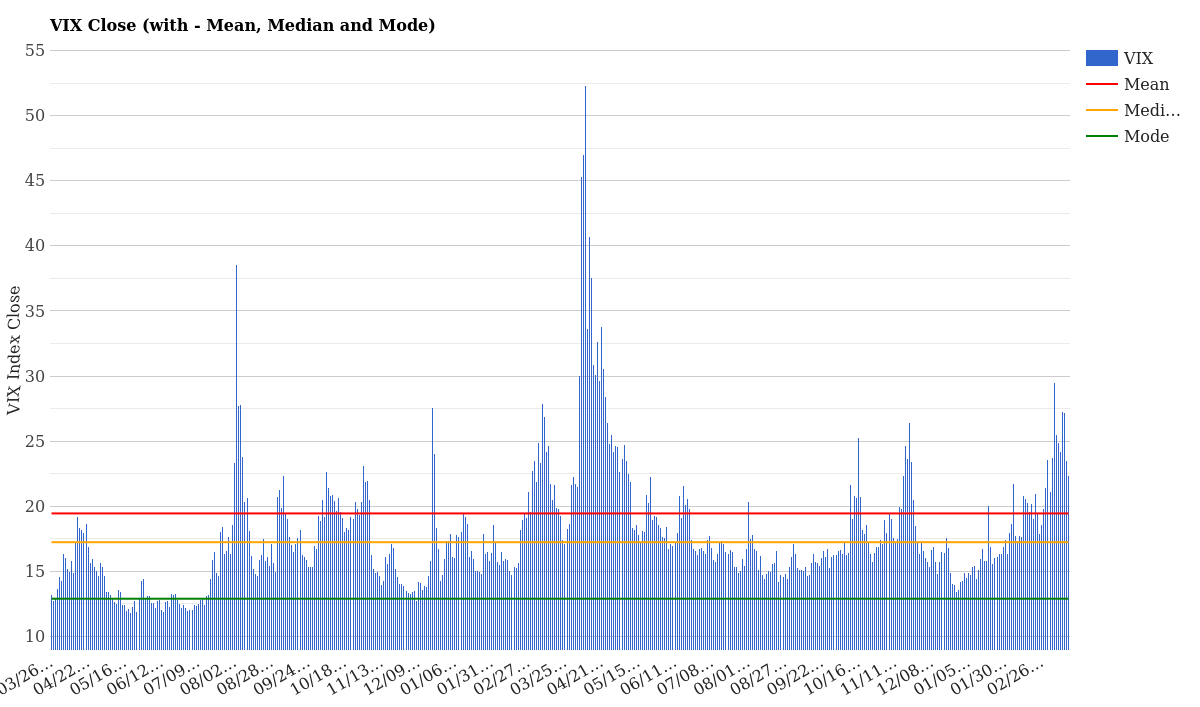
VIX Close with Mean, Median and Mode – March 18, 2026
Current VIX Status
| Metric | Value | Historical Reference | Assessment |
|---|---|---|---|
| VIX Today | 22.37 | Mean: 19.45 | Median: 17.24 | Elevated but trending lower |
| Daily Change | -1.14 (-4.85%) | Previous close: 23.51 | Fear receding, positive for equities |
| 5-Day Change | -1.86 (-7.68%) | Last week: 24.23 | Clear downtrend signals stabilization |
| vs. 2Y Mean | +2.92 (+15.0%) | Mean: 19.45 | Above average, but gap narrowing |
| vs. 2Y Median | +5.13 (+29.8%) | Median: 17.24 | Notably elevated vs typical levels |
| 1-Year Percentile | 63.2% | Scale: 0-100 | Above median past-year volatility |
| Year-to-Date Percentile | 100.0% | Scale: 0-100 | Highest YTD close still in effect |
| Volatility Status | Elevated | Above mean, declining trend | Positive momentum for risk assets |
VIX Term Structure Analysis
The VIX term structure represents the market’s expectations for volatility across different time horizons. Today’s curve shows a contango pattern, which is the normal, healthy configuration. This means near-term volatility (VIX9D at 22.36) is lower than intermediate-term volatility (VIX3M at 24.33) and longer-term volatility (VIX1Y at 25.43). This structure indicates that market participants expect current elevated volatility to gradually subside over the coming weeks and months.
| Contract | 03/17/26 | 03/16/26 | 03/13/26 | 03/12/26 | 03/11/26 |
|---|---|---|---|---|---|
| VIX9D | 22.36 | 24.33 | 28.00 | 28.98 | 24.44 |
| VIX (Spot) | 22.37 | 23.51 | 27.19 | 27.29 | 24.23 |
| VIX3M | 24.33 | 24.92 | 27.28 | 26.95 | 24.97 |
| VIX6M | 25.28 | 25.63 | 27.43 | 27.26 | 25.85 |
| VIX1Y | 25.43 | 25.63 | 26.75 | 26.24 | 25.43 |
Over the past five trading days, the contango structure has been consistent. The curve has flattened overall-observe that VIX9D has declined from 28.00 on March 13 to 22.36 today, while longer-dated contracts (VIX6M and VIX1Y) have remained relatively stable around 25-26. This flattening is typical as short-term fear diminishes faster than the market reassesses medium-to-long-term risk. The spread between spot VIX (22.37) and the one-year contract (25.43) sits at approximately 3.06 points, providing a normal premium for longer-dated uncertainty.
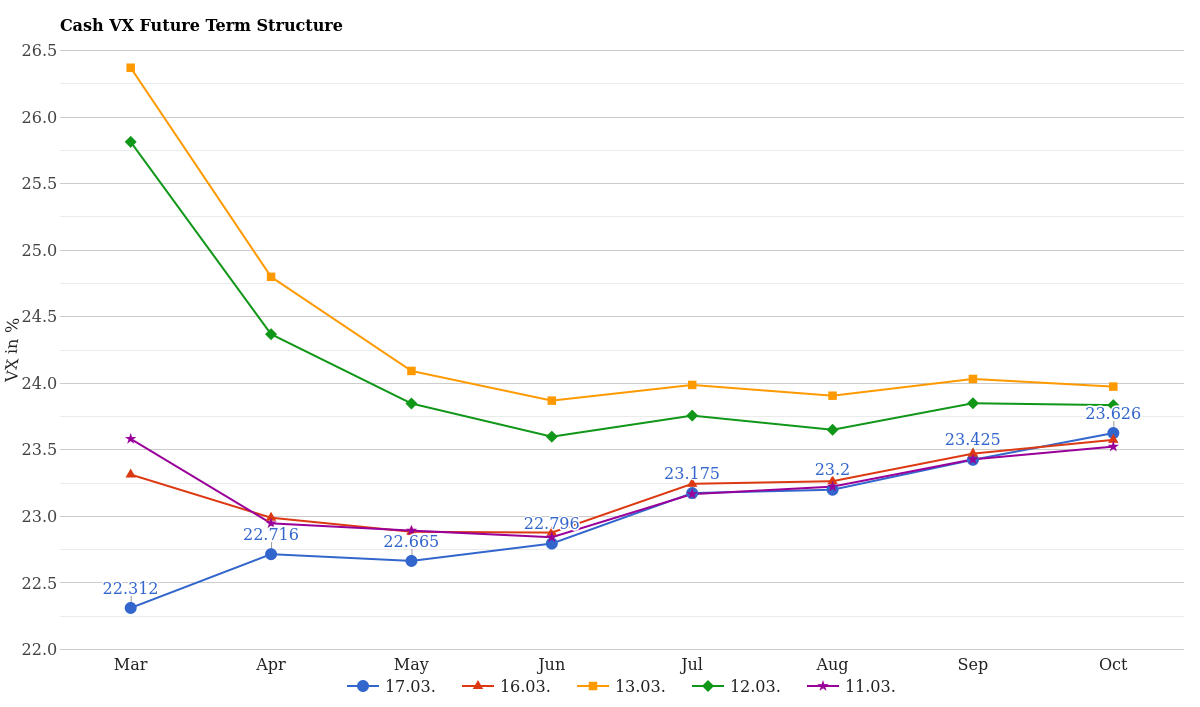
VIX Future Term Structure (VIX9D to VIX1Y) – Last 5 Days
Cash VIX Futures Curve Analysis
Examining the monthly cash VIX futures curve from March through October provides insight into how market sentiment evolves across quarters. The current curve shows a gradual upslope moving from March (22.31) through October (23.63), characteristic of a market pricing in seasonal uncertainty while not expecting catastrophic volatility ahead.
| Month | 03/17/26 | 03/16/26 | 03/13/26 | 03/12/26 | 03/11/26 | 5-Day Trend |
|---|---|---|---|---|---|---|
| March | 22.31 | 23.31 | 26.37 | 25.81 | 23.58 | -1.27 |
| April | 22.72 | 22.99 | 24.80 | 24.37 | 22.95 | -0.23 |
| May | 22.67 | 22.88 | 24.09 | 23.85 | 22.89 | -0.22 |
| June | 22.80 | 22.88 | 23.87 | 23.60 | 22.84 | -0.04 |
| July | 23.18 | 23.24 | 23.99 | 23.76 | 23.17 | 0.01 |
| August | 23.20 | 23.26 | 23.91 | 23.65 | 23.22 | -0.02 |
| September | 23.43 | 23.47 | 24.03 | 23.85 | 23.43 | 0.00 |
| October | 23.63 | 23.58 | 23.98 | 23.84 | 23.52 | 0.11 |
Five-Day Trend Analysis: All near-term months (March through June) show declining volatility expectations, with the March contract down 1.27 points over the five-day window. This pattern confirms that market participants are gradually becoming less fearful of near-term shocks. The consistency of this downtrend across the curve suggests a broad-based reduction in risk priced into derivatives. Mid-range months (July and August) are essentially flat, while October edges slightly higher, reflecting expectations of elevated seasonal volatility entering Q4 2026. This is a textbook healthy market calibration, neither too complacent nor too pessimistic.
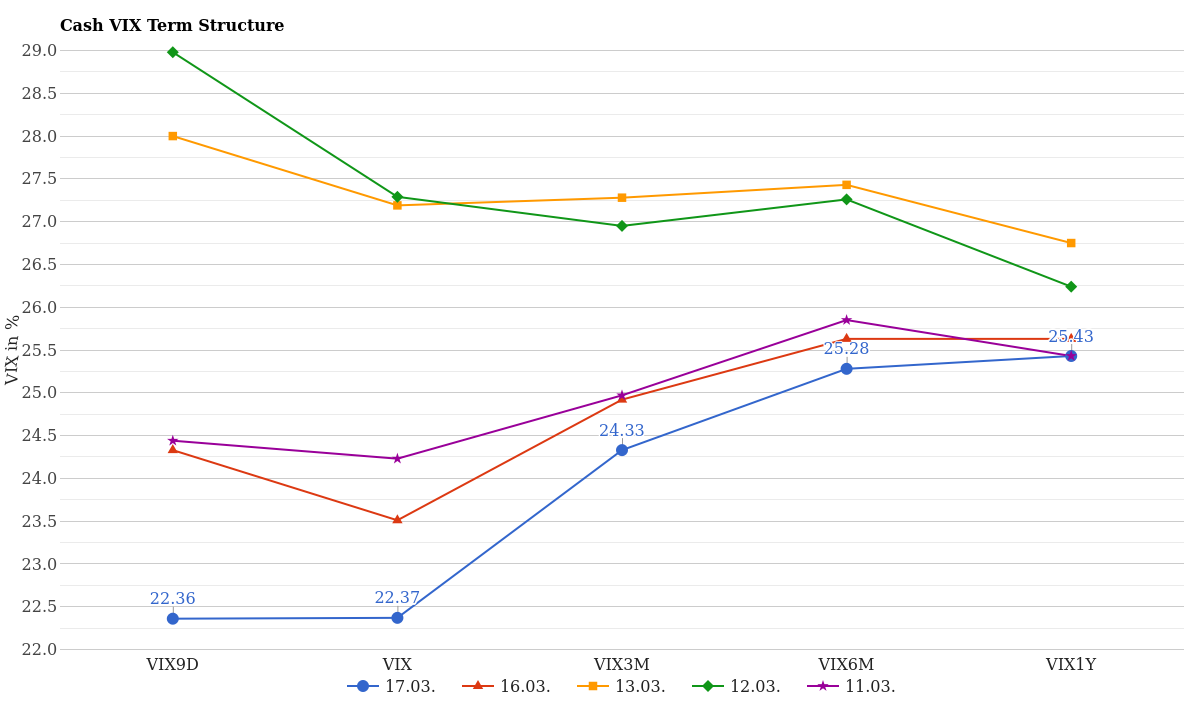
Cash VIX Future Term Structure – Last 5 Days
Historical Volatility Context – One Year Distribution
Understanding where today’s VIX reading falls within the historical distribution helps contextualize its significance. The past year of trading data reveals the frequency at which the VIX has traded at each level.
| VIX Level | Days at Level | Percentage of 1Y | Notes |
|---|---|---|---|
| 13-14 | 25 | 10.0% | Low volatility base level |
| 15-17 | 89 | 35.6% | Most common range (includes median) |
| 18-21 | 55 | 22.0% | Slightly elevated (includes mean) |
| 22-25 | 59 | 23.6% | Current zone (TODAY: 22.37) |
| 26-32 | 23 | 9.2% | High stress territory |
| 33-52 | 5 | 2.0% | Crisis/panic levels (rare) |
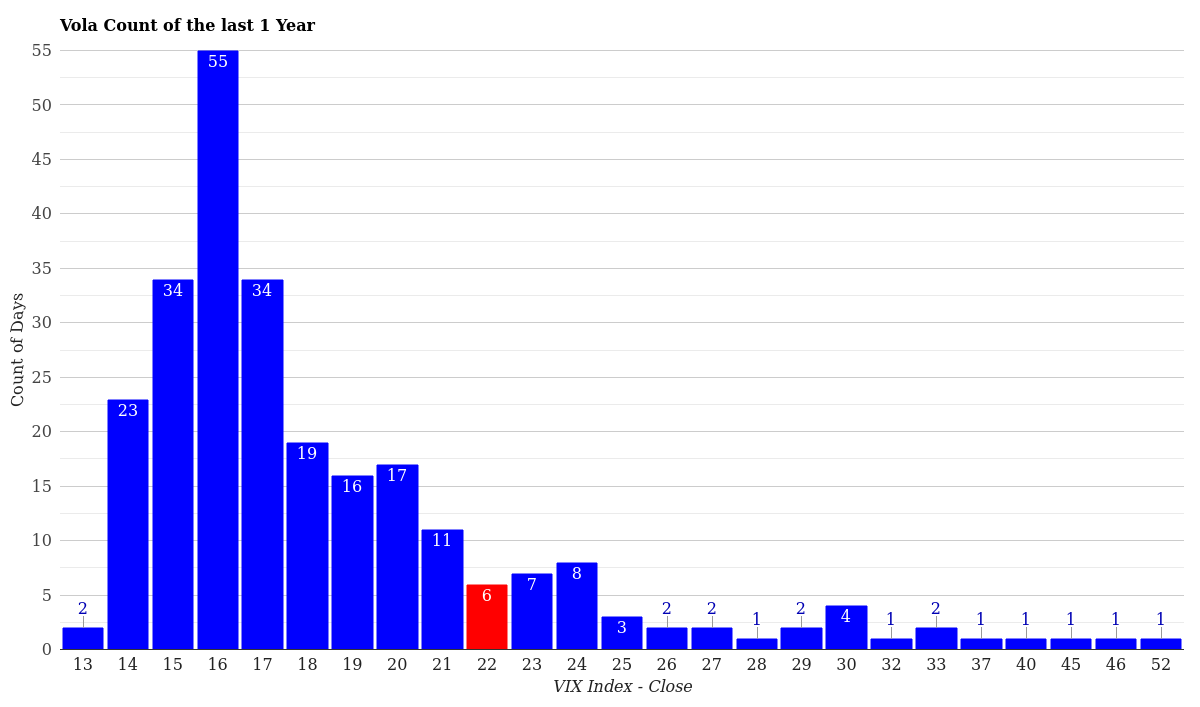
VIX Volatility Distribution – Last 12 Months
Year-to-Date Comparison: The YTD distribution tells a distinctly different story than the full past year. Year-to-date, the VIX has spent most trading days in the 14-21 range (representing roughly 85% of YTD observations), with very few excursions above 22. The jump to 22.37 today places this reading in the top tier of 2026 price action so far, explaining the 100.0 percentile reading. This indicates that Q1 2026 has been remarkably calm relative to the tumultuous Q2-Q4 period of 2025, which saw multiple stress episodes pushing the VIX above 40. The fact that today’s level, while elevated, is below 25, suggests the market is successfully digesting its recent concerns rather than entering a new crisis phase.
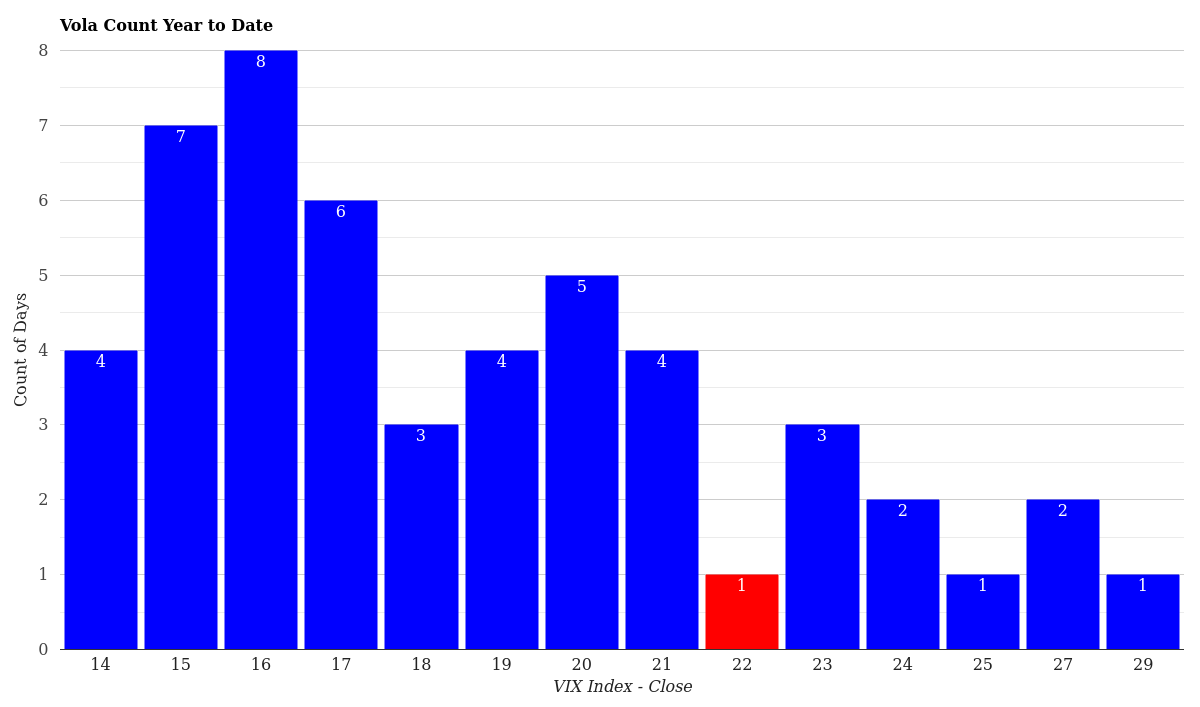
VIX Volatility Distribution – Year to Date
What This Means for Traders
Short-Term Implications: At 22.37, the VIX is pricing in modest but real equity market uncertainty. Options traders should expect increased premiums compared to the historical mean-put options and call spreads will carry higher prices than they did in quieter periods. Call buyers face higher costs, while put sellers receive more attractive premium. For directional traders, a VIX reading in the 22-25 zone typically aligns with modest single-digit daily equity market moves (often 0.5-1.5% daily swings on major indices).
Options Pricing Effects: The contango term structure currently pricing expansion of volatility across longer timeframes creates opportunities for volatility sellers. Calendar spreads (selling near-term VIX futures and buying longer-dated contracts) benefit from the slope. Conversely, volatility buyers might seek to establish positions in longer-dated options at prices that reflect the elevated intermediate-term term structure while spot volatility remains lower.
Key Technical Levels to Monitor: Watch these VIX milestones in the coming days:
- 19.45: The two-year mean-a break below this would signal transition to genuinely calm markets.
- 17.24: The two-year median-sustained movement below here would indicate a return to very calm conditions not seen in recent weeks.
- 25.00: A psychological ceiling; breach would signal escalation to moderate stress territory.
- 30.00: High-stress threshold; VIX reaching 30+ traditionally accompanies equity drawdowns exceeding 5%.
Conclusion
The VIX at 22.37 on March 18, 2026, reflects a market in transition-elevated volatility relative to historical norms, but declining with encouraging momentum. The five-day downtrend of 7.68%, combined with a healthy contango term structure, suggests that recent market stress is being systematically repriced lower. Traders should monitor whether the VIX successfully breaks below 20 in the coming week, which would signal a full return to pre-stress baseline volatility. The current environment favors measured risk-taking with attention to downside hedging, as the elevated volatility offers both opportunities (higher option premiums for sellers) and caution (larger daily drawdown risks for long portfolios).
DISCLAIMER: This article is for informational and educational purposes only and does not constitute financial, investment, or trading advice. All data provided is historical and statistical in nature. Past volatility levels and market patterns are not indicative of future results. The VIX Index measures implied volatility of S&P 500 index options and is subject to rapid changes based on market conditions. Trading derivatives and options carries substantial risk of loss. Readers should conduct their own research and consult with qualified financial advisors before making any investment or trading decisions. StockBotty and the author assume no responsibility for trading losses resulting from use of this information.
AUTHOR DISCLOSURE: The author may hold positions in VIX-related instruments, S&P 500 index options, volatility derivatives, or other equity and fixed-income securities either directly or through managed accounts at the time of publication. This disclosure is provided in accordance with securities regulations and ethical publishing standards. Readers should not interpret this article as a personal recommendation and should seek independent financial advice.
For more market analysis, volatility insights, and trading strategies visit stockbotty.com | Disclaimer