
VIX at 26.15: Backwardation Signals Elevated Near-Term Fear
The VIX currently stands at 26.15, reflecting a market environment where anxiety about short-term moves exceeds confidence in longer-term stability. Markets are pricing in meaningful uncertainty over the next week and month, even as six and twelve-month volatility expectations remain slightly elevated. Today’s report unpacks what this term structure tells us, how rare this reading is historically, and what traders should be watching right now.
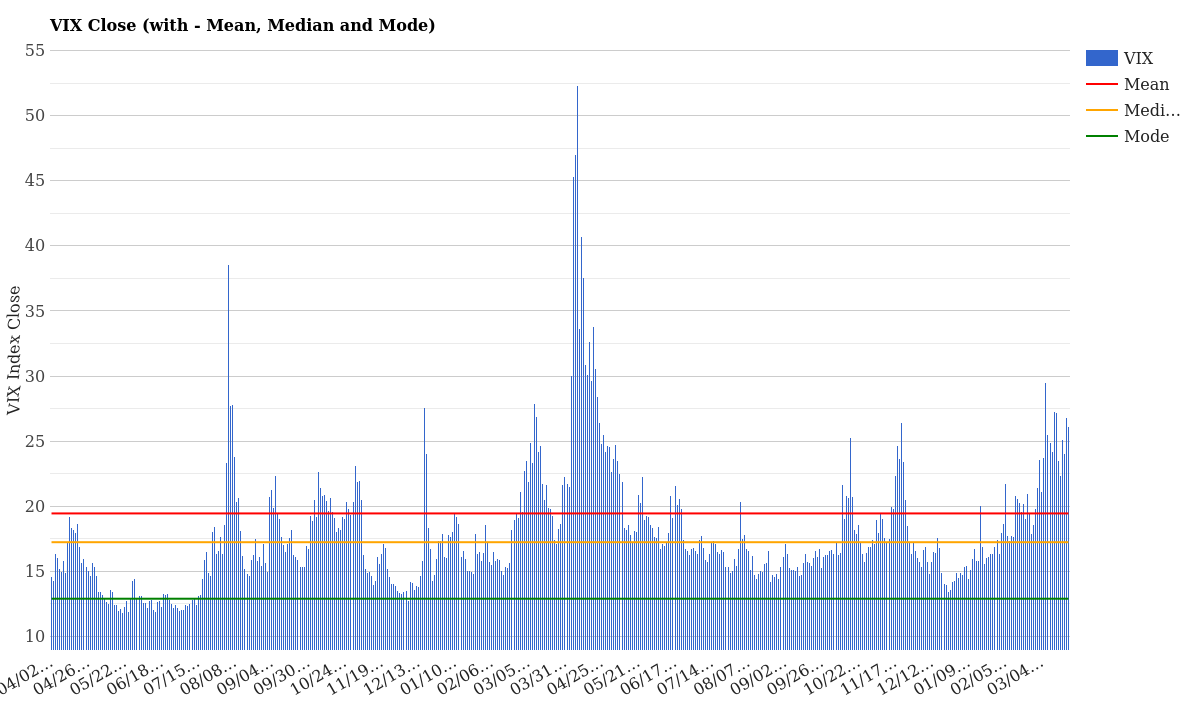
VIX Close with Mean, Median and Mode – March 24, 2026
What the Current VIX Level Means
At 26.15, the VIX sits 6.70 points above the 2-year mean of 19.45 and 8.91 points above the median of 17.24. This places today’s level firmly in the high volatility zone, signaling that traders perceive real risk in the market right now. For context, the VIX spends roughly 30% of its time below 15 and 70% of its time below 20-so a 26.15 reading means we’re in elevated territory.
The market moved slightly lower overnight, with the VIX declining 0.63 points (-2.35%) from yesterday’s close of 26.78. However, zooming out reveals a more important picture: over the past five trading days, volatility has climbed 3.78 points (+16.90%). This suggests recent stress in equities rather than calm consolidation.
If you are new to volatility analysis, read our complete VIX guide before diving into the numbers. Understanding the mechanics behind the index helps traders interpret what today’s levels actually signal about market psychology.
| Metric | Value | Status |
|---|---|---|
| VIX Current | 26.15 | High |
| Daily Change | -0.63 (-2.35%) | Slightly Lower |
| 5-Day Change | +3.78 (+16.90%) | Rising Trend |
| vs. 2-Year Mean (19.45) | +6.70 | Well Above Avg |
| vs. 2-Year Median (17.24) | +8.91 | Significantly Elevated |
| 1-Year Percentile | 74.3% | Upper Quartile |
| YTD Percentile | 100.0% | Highest of 2026 |
Notice the YTD percentile: at 100%, today’s VIX is the highest level we’ve seen since January 1, 2026. This is a meaningful marker. The market has been gradually creeping higher in volatility terms throughout the first quarter, with early-2026 starting relatively calm around 14-15 and now settling into the mid-to-high 20s.
VIX Term Structure: Short-Term vs Long-Term Fear
One of the most telling features of today’s volatility environment is the shape of the term structure-the curve showing what fear costs at different time horizons. Today we see classic backwardation: short-dated volatility is higher than longer-dated volatility.
| Tenor | 23 March | 20 March | Interpretation |
|---|---|---|---|
| VIX9D (9-day) | 27.76 | 26.95 | Highest Point |
| VIX (Spot) | 26.15 | 26.78 | Reference Level |
| VIX3M (3-month) | 26.10 | 27.43 | Slight Decline |
| VIX6M (6-month) | 26.94 | 28.35 | Moderates |
| VIX1Y (1-year) | 26.52 | 26.84 | Stays Elevated |
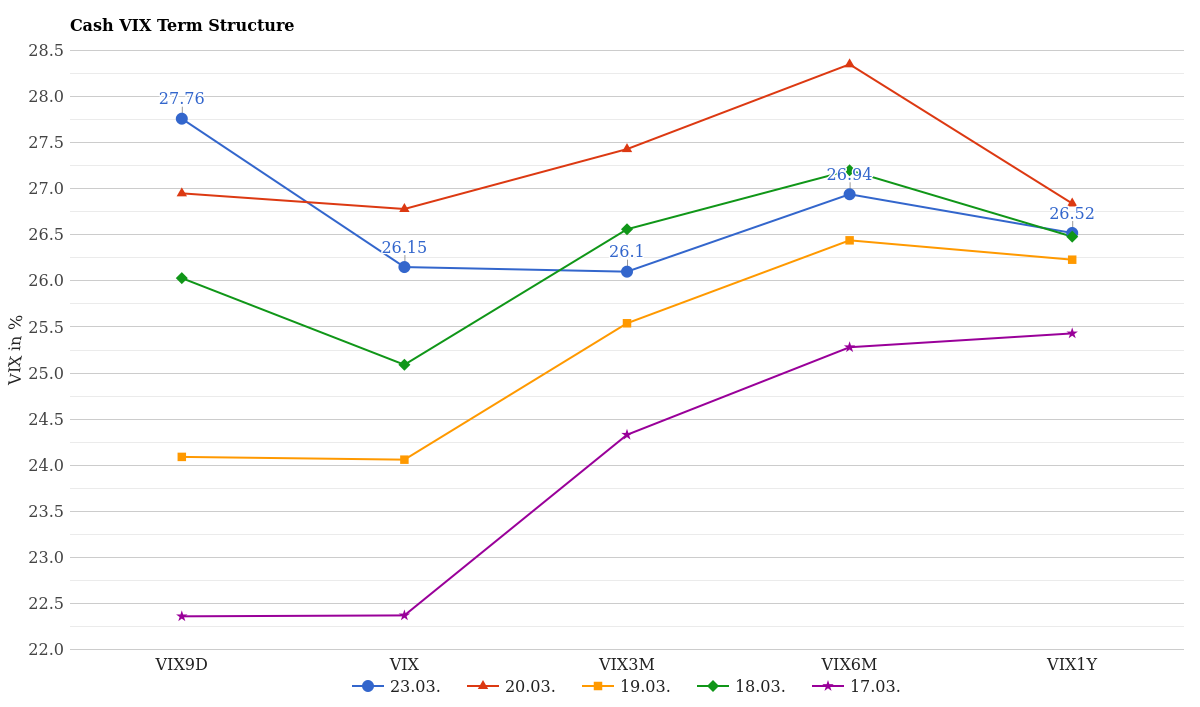
VIX Term Structure (VIX9D to VIX1Y) – Last 5 Days
The structure 27.76 → 26.15 → 26.10 → 26.94 → 26.52 tells an important story. The 9-day volatility is the highest point on the curve, meaning traders are most concerned about what happens in the next one to two weeks. This is textbook backwardation-a defensive posture where near-term uncertainty commands a premium.
What’s notable is that the long end (6-month and 1-year volatility) hasn’t collapsed. At 26.94 and 26.52 respectively, these levels remain well above historical averages. The market isn’t saying “don’t worry, this will blow over by summer.” Instead, it’s saying “we expect elevated uncertainty to persist, but the immediate next two weeks are the critical period.”
This pattern often emerges when traders face a known catalyst or event window-earnings season transitions, policy announcements, or macro data surprises. The fact that longer-dated implied volatility hasn’t cratered suggests structural uncertainty rather than a one-off spike.
How Volatility Has Changed This Week
Comparing the current VIX cash curve against data from March 17 reveals a persistent shift higher across the entire maturity spectrum. Let’s examine the monthly tenors over the past week.
| Expiry Month | 23 March | 17 March | Change | Direction |
|---|---|---|---|---|
| April | 24.30 | 22.72 | +1.58 | Higher |
| May | 23.60 | 22.67 | +0.93 | Higher |
| June | 23.40 | 22.80 | +0.60 | Higher |
| July | 23.55 | 23.18 | +0.37 | Higher |
| August-November | 23.55-23.68 | 23.20-23.63 | +0.35 avg | Modest Rise |
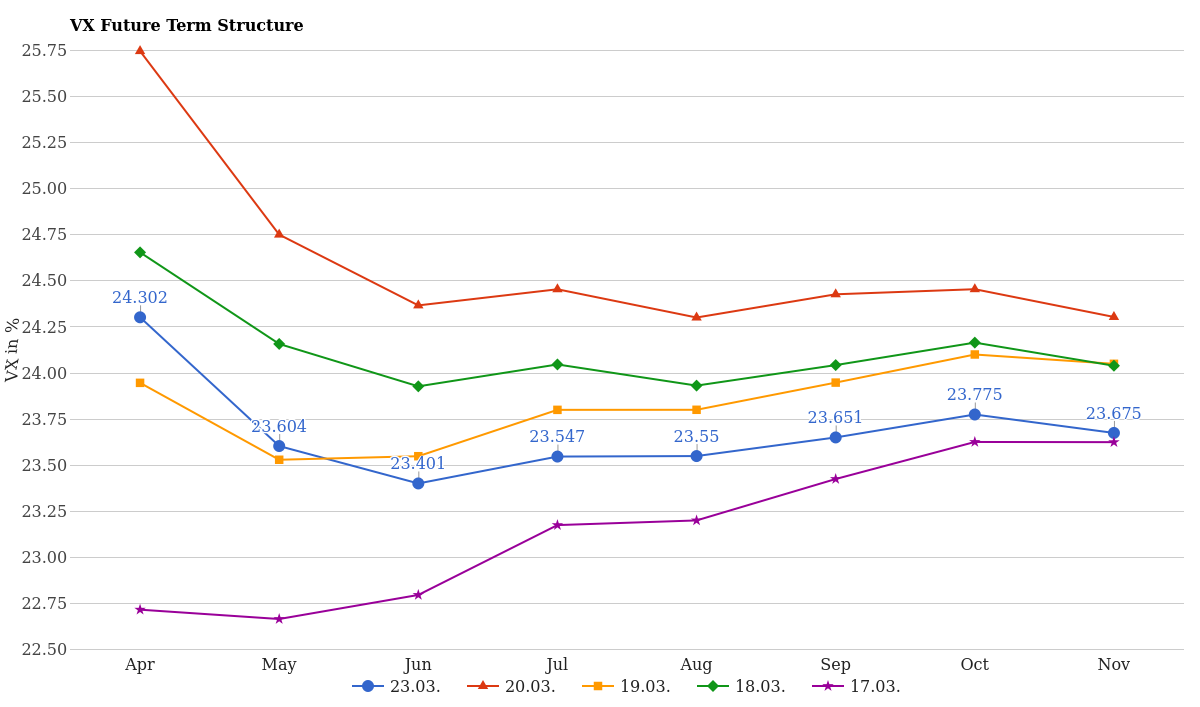
VX Future Term Structure – Last 5 Days
Over the past week, volatility across the entire term structure has risen steadily. April volatility jumped 1.58 points, the largest move, reflecting elevated concern about the very near term. Even far-out contracts (August through November) have crept higher by roughly 0.35 points, suggesting this isn’t just a narrow spike-it’s a broadening of uncertainty.
The progression shows near-term anxiety is highest (backwardation), but the elevation is real across tenors. This is typical of genuine market stress rather than a short-covering rally or technical bounce. Traders are not significantly discounting away the risk as we look further into the future.
How Rare Is This VIX Level Historically?
To understand whether 26.15 is an outlier or part of a growing pattern, we can compare it against historical frequency data. Over the past 12 months, how often has the VIX traded at this level?
| VIX Range | 12-Month Count | YTD Count (2026) | Frequency |
|---|---|---|---|
| 13-14 | 25 | 4 | Common (Calm) |
| 15-17 | 89 | 21 | Very Common (Normal) |
| 18-20 | 44 | 14 | Frequent (Elevated) |
| 21-25 | 55 | 8 | Moderate (Stressed) |
| 26-30 | 11 | 2 | Rare (High Stress) |
| 31-40 | 2 | 0 | Very Rare (Crisis) |
| 40+ | 1 | 0 | Extreme (Panic) |
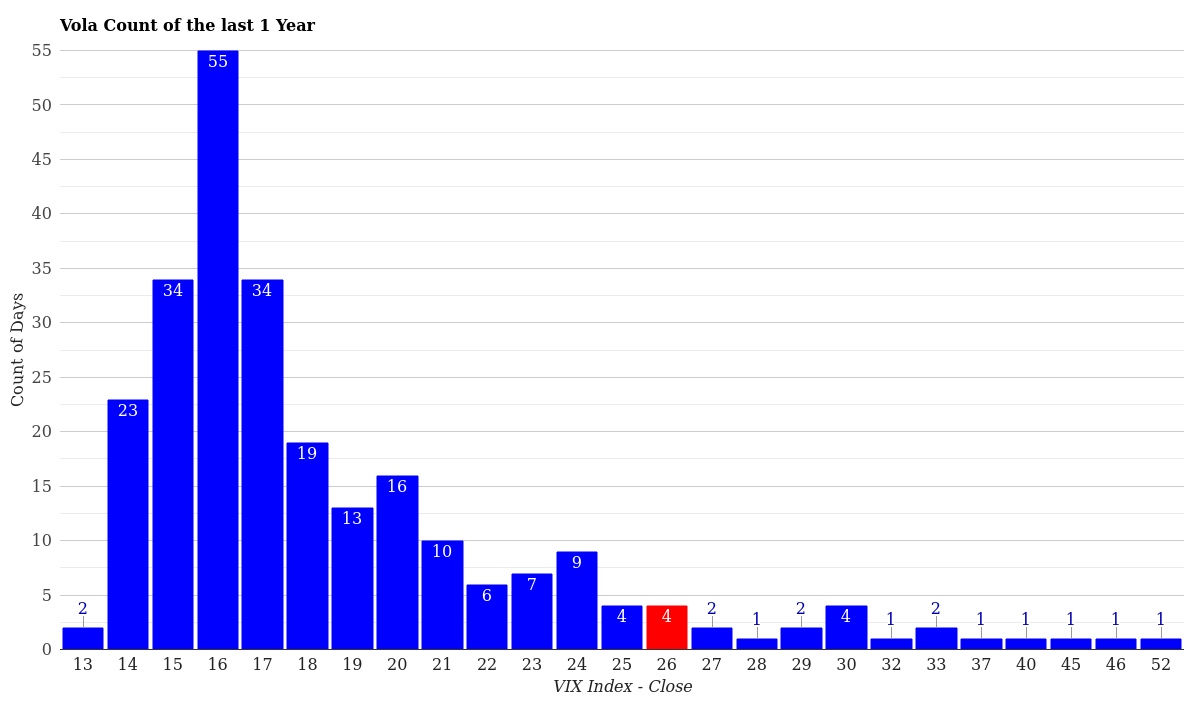
VIX Volatility Distribution – Last 12 Months
Today’s 26.15 falls into the 26-30 bracket, where the VIX has traded only 11 times in the past 12 months. This makes it genuinely uncommon but not unprecedented. For 2026 alone, we’ve only seen this level twice, underscoring that the first quarter has shifted noticeably toward stress relative to the earlier 2025 baseline.
The data shows a clear clustering in the 15-20 range (very common) and 21-25 range (moderate). Readings above 26 jump to the rare category. When we do see the VIX climb into the upper 20s, it typically signals either a tactical capitulation event (which may reverse quickly) or the start of a sustained period of elevated uncertainty.
Importantly, we haven’t traded near the extreme panic levels (40+) that we saw during the April 2025 selloff. Today’s environment feels more like a “worry but not terror” market, where risk-off sentiment is real but not yet cascading into forced selling or institutional deleveraging.
What This Means for Traders Right Now
A VIX at 26.15 with backwardated term structure carries several practical implications for traders positioning right now.
Short-term hedging is expensive. If you want protection against a drop in the S&P 500 or other equities over the next 1-2 weeks, you’re paying 27.76 (VIX9D). This elevated cost reflects consensus concern about an imminent catalyst or correction. Call spreads, collar strategies, and protective puts are all pricier than they were a week ago.
Longer-dated upside is cheaper on a relative basis. The fact that 3-month volatility (26.10) is barely lower than spot volatility (26.15) suggests traders aren’t confident about a quick resolution. However, 6-month implied volatility (26.94) being above spot hints that some uncertainty extends beyond the immediate window. Traders considering directional bets with longer expiration dates may find more attractive risk-reward in slightly out-of-money calls or call spreads.
Volatility mean reversion is a two-way trade. History shows that when VIX climbs into the 25-30 range, reversions tend to be either sharp (if a specific event clears) or gradual (if the environment stays uncertain). Watch how April expiration behavior; if volatility stays elevated through early April, it may signal underlying equity weakness persisting through tax season and earnings.
Portfolio implications remain defensive. With spot VIX at 26.15, near-term volatility pricing and a flattened (but still elevated) term structure, a reasonable tactical approach is to favor quality, dividend-paying names over growth, maintain raised cash levels, and avoid adding leverage into strength. Mean reversion almost always happens in VIX, but timing it is notoriously difficult.
Conclusion and Market Outlook
At 26.15, the VIX is flashing an amber light-not a red one, but definitely a signal to pay closer attention. The backwardated term structure, with 9-day volatility peaking at 27.76, suggests traders are most concerned about the immediate next one to two weeks. Longer-dated volatility hasn’t cratered, pointing to structural uncertainty rather than a short-term spike.
Year-to-date, this is the highest VIX reading of 2026. Over a 12-month lookback, a 26.15 level appears roughly 11 times, making it rare but not extreme. The question now is whether this represents a tactical buying opportunity (for those bullish on a resolution) or a warning signal that equity weakness could persist.
Key levels to monitor: Support comes around 23-24 (mean-ish territory). Resistance and concern intensifies if the VIX pushes above 28. Keep an eye on what April volatility does when the March 29 expiration passes; if April futures stay elevated, it signals the market expects April to bring continued risk.
For more detailed analysis and daily market updates, visit stockbotty.com. Subscribe to our volatility alerts to track VIX moves in real time.
For more market analysis, volatility tracking, and trading education, visit stockbotty.com | Disclaimer and Terms