
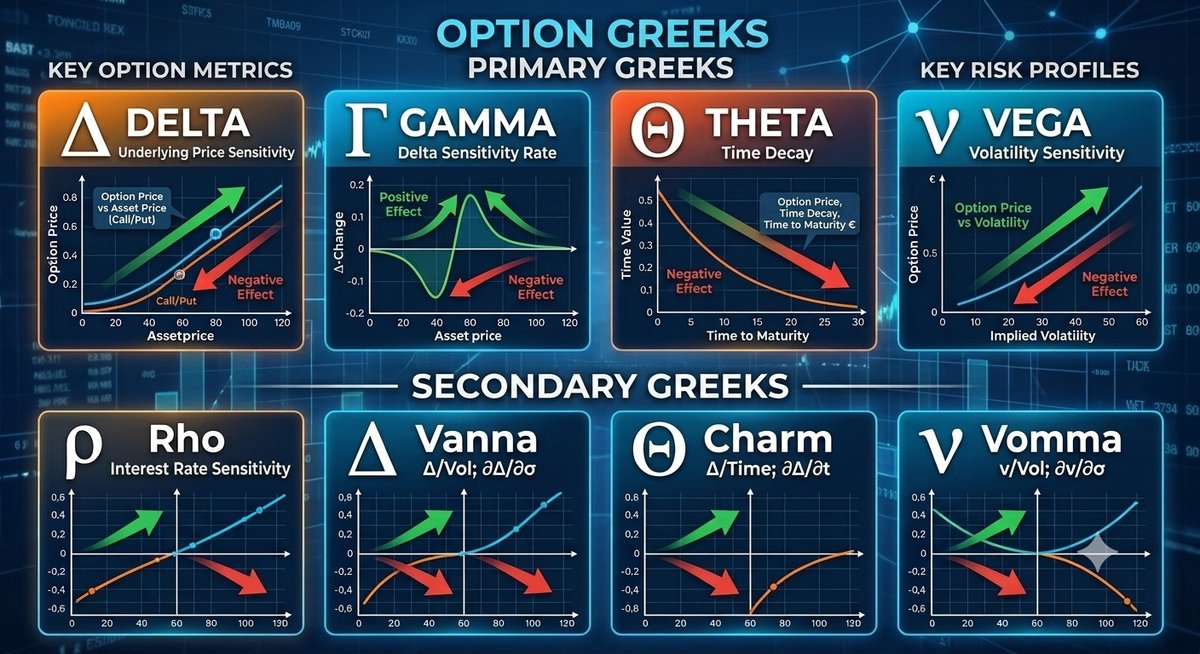
Every strategy guide on this site references the Greeks in passing – theta decay here, gamma risk there. This page goes deeper: what each Greek actually measures (including the parts that get oversimplified), why a Greek’s behavior depends on where the option sits relative to the strike, and – the part most explanations skip entirely – how the Greeks are not independent numbers sitting in separate boxes. A move in one factor routinely triggers several Greeks at once, and understanding that interaction is what separates a surface-level read of an option chain from actually understanding what’s about to happen to a position.
Delta – Direction, and Also Probability, But Not Quite the Same Thing
Delta measures how much an option’s price changes for a $1 move in the underlying. A 0.40 delta call gains roughly $0.40 in value if the stock rises $1. That part is standard and correct.
What often gets left out: delta is also commonly used as a rough proxy for the probability that an option finishes in the money at expiration. A 0.30 delta option is often described as “roughly a 30% chance of expiring ITM.” This is a useful approximation, but it is an approximation, not a definition – delta and the true probability of finishing in the money are two distinct mathematical quantities that happen to be numerically close under common assumptions (particularly for shorter-dated, near-the-money options with a fairly standard volatility skew). They can diverge, especially with a pronounced volatility skew or longer time to expiration. Delta is still useful as a quick probability estimate, especially for strike selection – the 20-30 delta convention used throughout the strategy guides on this site is really a shorthand for “roughly a 20-30% chance of being tested” – but it’s worth knowing it’s a proxy, not the actual probability the market is pricing.
Gamma – Delta’s Own Rate of Change
Gamma measures how much delta itself changes for a $1 move in the underlying. It’s technically the second derivative of the option’s price with respect to the stock price – which is exactly why it’s sometimes classified alongside the “second-order” Greeks even though it gets treated as one of the primary four in everyday use. Gamma is highest for at-the-money options and grows sharply as expiration approaches, which is the mechanical reason behind the “gamma risk near expiration” warning repeated throughout the strategy guides on this site: a position sitting near a strike in its final days can see its delta swing quickly on a small stock move, because gamma – the rate at which delta itself moves – is at its most extreme right there.
Theta – Time Decay Isn’t One Curve, It’s Three
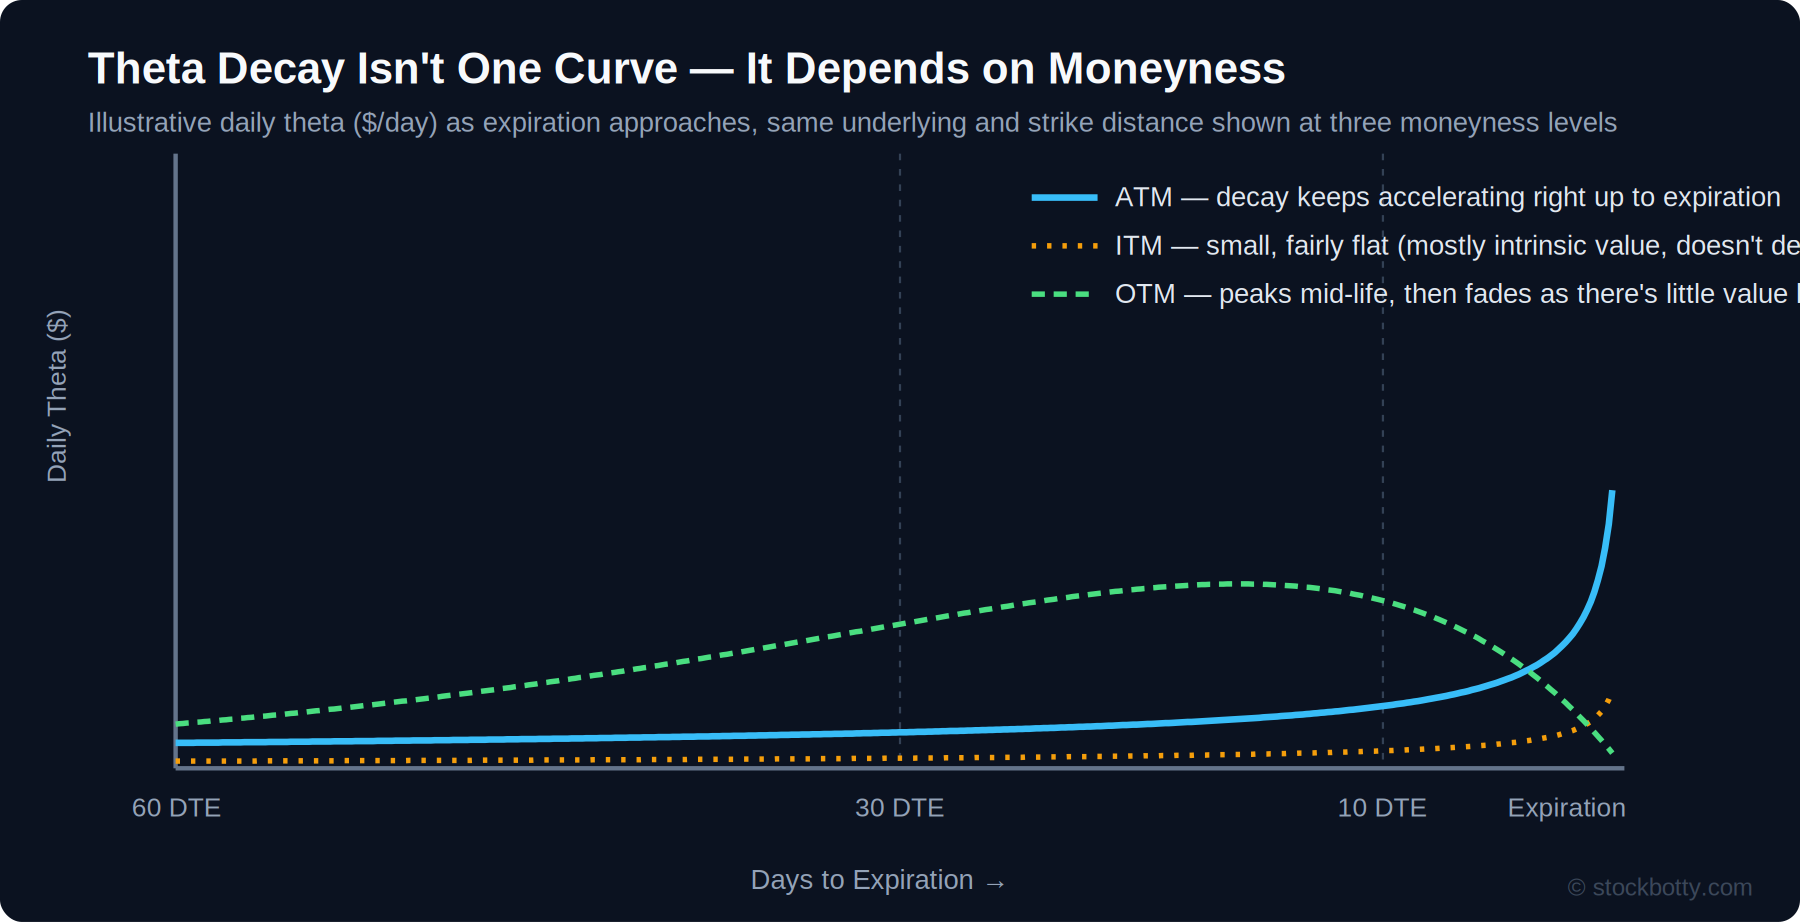
The standard “theta decay accelerates as expiration approaches” chart shown almost everywhere is accurate – but only for an at-the-money option. That single curve gets generalized to all options, which is misleading, because in-the-money and out-of-the-money options decay on genuinely different paths.
- At-the-money: extrinsic value is at its maximum here, and it decays slowly at first, then accelerates sharply in the final one to two weeks. This is the classic hockey-stick curve, and it’s the one case where “decay accelerates all the way to expiration” is actually true.
- In-the-money: most of the option’s value is intrinsic – the difference between the stock price and the strike – and intrinsic value does not decay at all. Only the smaller extrinsic sliver is subject to theta, so the daily dollar decay stays comparatively small and fairly flat through most of the option’s life, without the dramatic late acceleration seen at the money.
- Out-of-the-money: extrinsic value is smaller from the start, since there’s less chance of the option ever being worth anything. Theta often peaks somewhere in the middle of the option’s remaining life and then declines heading into expiration – not because time decay has stopped mattering, but because there’s very little dollar value left to lose in the final days if the option is still out of the money.
Practically, this means a short strangle or iron condor’s short legs decay differently depending on how far out of the money they sit, a covered call written deep in the money won’t show the dramatic decay curve many traders expect from it, and “sell premium and collect accelerating theta” is really a statement about at-the-money or near-the-money short options specifically, not a universal property of all short options.
Vega – Sensitivity to the Market’s Own Uncertainty
Vega measures how much an option’s price changes for a 1-percentage-point change in implied volatility. Unlike delta and theta, vega isn’t about what the stock is doing or how much time has passed – it’s about how uncertain the market currently is about the future, as priced into the option itself. Vega is highest for at-the-money options and, all else equal, higher for options with more time to expiration, since longer-dated options have more time for that uncertainty to play out. This is also why calendar spreads – built on the same strike across two different expirations – carry a net vega exposure at all: the longer-dated leg simply has more vega than the shorter-dated one.
Rho – The Quiet One
Rho measures sensitivity to interest rates. For the short-dated retail strategies covered throughout this site, its effect is usually small enough to ignore in practice. It becomes more relevant for longer-dated options (LEAPS) or during periods of significant rate volatility, but for most 30-45 day strategies discussed elsewhere on this site, rho is a rounding error next to delta, theta, and vega.
The Greeks Are Not Independent: How They Interact
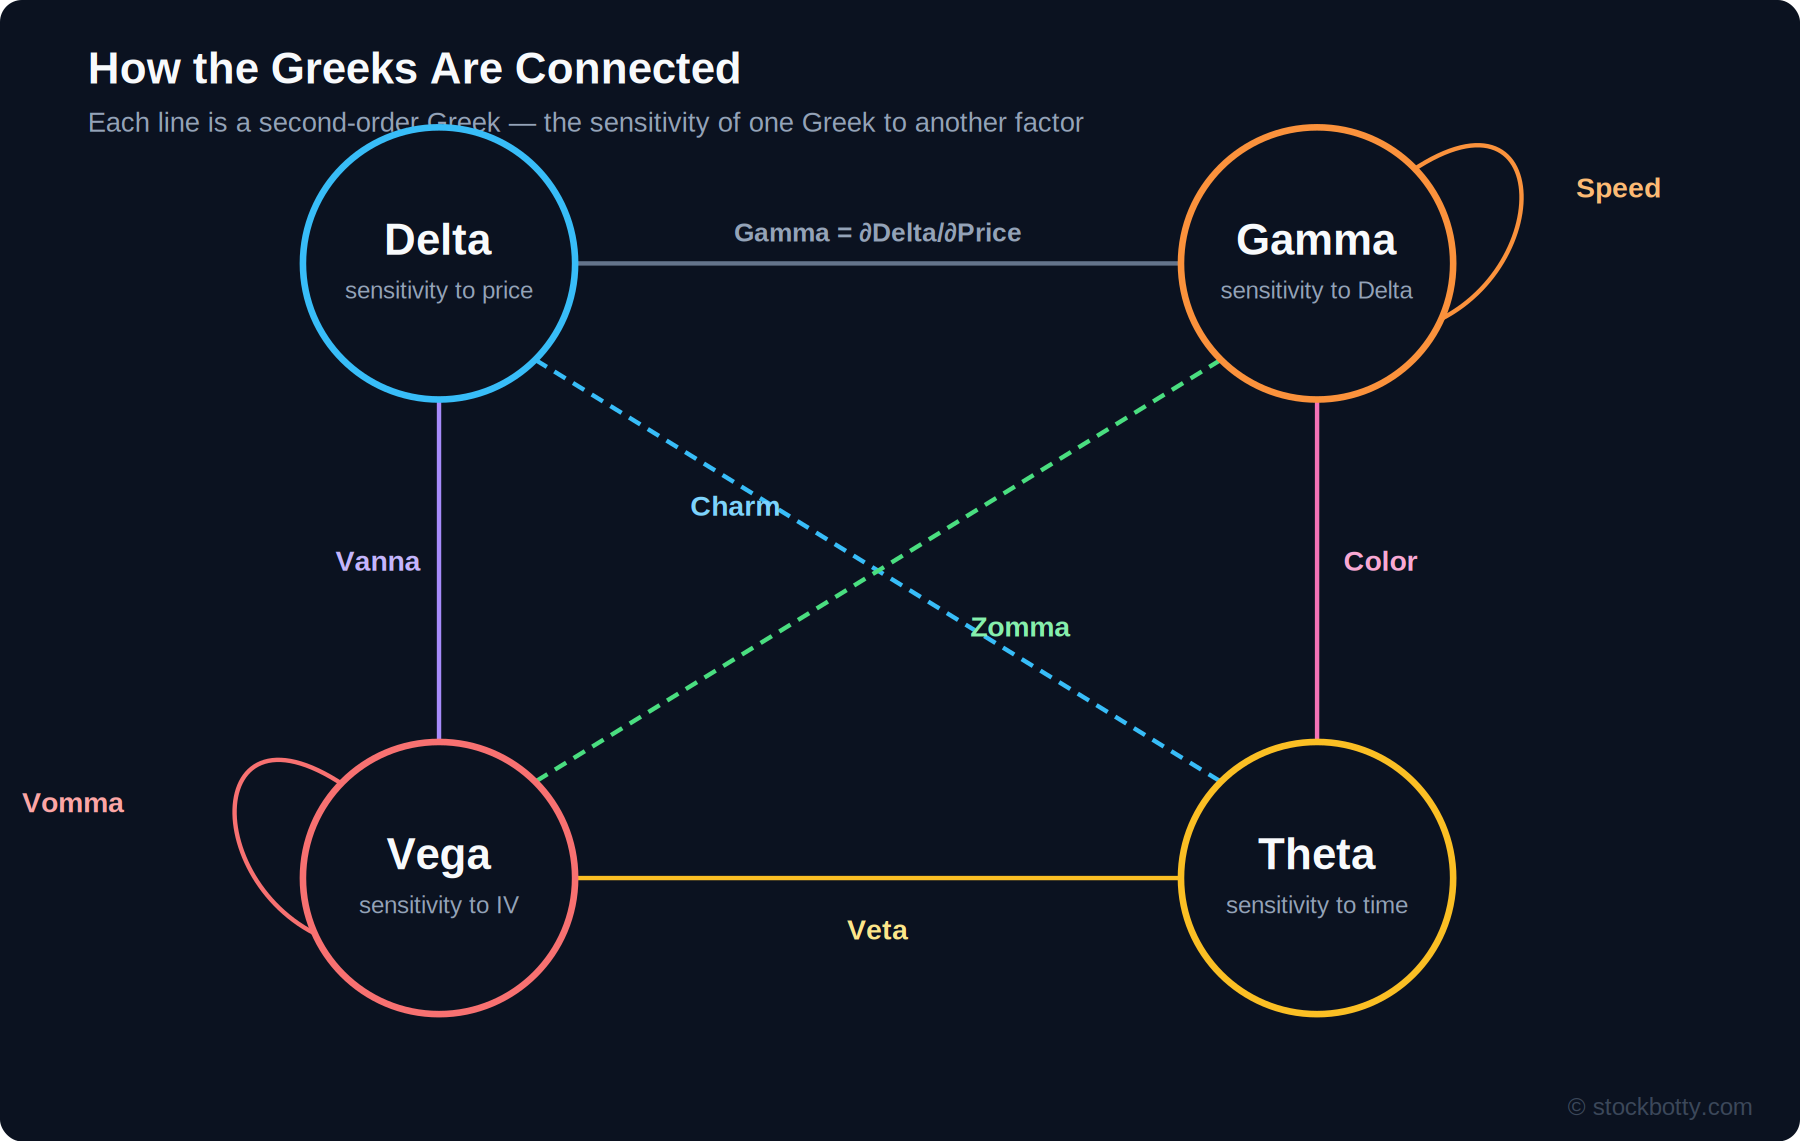
Treating each Greek as its own isolated number is the single biggest gap in most explanations of options risk. In reality, the Greeks describe a position’s sensitivity to price, time, and volatility – and each of those sensitivities has its own sensitivity to the other factors. That’s what the second-order Greeks actually are: not an advanced curiosity for market makers, but the wiring that connects Delta, Gamma, Theta, and Vega to each other.
- Vanna connects Delta and Vega – it’s how much Delta shifts purely because implied volatility changed, with no move in the stock at all.
- Charm connects Delta and time – it’s how much Delta drifts purely from a day passing, again with no move in the stock.
- Zomma connects Gamma and Vega – how much Gamma itself shifts as implied volatility changes.
- Color connects Gamma and time – how much Gamma grows as expiration approaches, which is the actual mechanism behind the gamma-risk warning mentioned earlier.
- Veta connects Vega and time – how much Vega itself shrinks as an option approaches expiration.
- Speed is Gamma’s own sensitivity to a further move in the stock – relevant for large, fast moves where gamma itself is changing quickly.
- Vomma is Vega’s own sensitivity to implied volatility – how much more (or less) vega-sensitive a position becomes as IV itself moves.
A Concrete Example: What Actually Happens When IV Spikes Into a Position
Say a trader is holding a long call going into an earnings report, with the stock sitting close to the strike. Implied volatility jumps sharply the day before the event, with the stock barely moving. A trader thinking only in terms of “I’m long vega, so this should help me” is seeing only one part of what’s happening:
- Vega does its obvious job – the option gains value directly from the higher IV.
- Vanna shifts Delta at the same time, purely because IV moved – depending on the position’s skew exposure, this can make the position more or less directionally sensitive than it was the day before, without the stock having moved at all.
- Vomma changes how much further vega itself will move if IV keeps climbing (or reverses) – the position’s vega exposure the next day is not the same vega exposure it had before the spike.
- Zomma quietly shifts gamma as well, changing how sharply delta will react to the next stock move, on top of whatever vanna already did to delta.
None of this requires the stock to move at all – a single change in implied volatility cascades through delta, vega, and gamma simultaneously via vanna, vomma, and zomma. This is also part of why aggregate vanna and charm exposure across all dealers in a name is discussed as a market-moving force in its own right (touched on in the options strategies overview alongside GEX): when a large volatility event hits a stock with heavy options positioning, the resulting dealer hedging isn’t driven by gamma alone – vanna and charm flows are part of the same mechanism, and they can push price around even without any new directional information entering the market.
A Second Example: Why Gamma Risk Builds Specifically Near Expiration
The “gamma risk in the final two weeks” warning that appears throughout the strategy guides on this site isn’t a separate phenomenon from the Greeks interacting – it is one. Color is Gamma’s sensitivity to time, and as color pushes gamma higher heading into expiration, every subsequent move in the stock produces a larger swing in delta than it would have a month earlier. The position hasn’t changed; the sensitivity of its own sensitivity has.
Why This Matters in Practice
None of this means a retail trader needs to calculate vanna or zomma by hand before every trade. It means treating “I’m short vega” or “I’m long gamma” as a complete picture of a position’s risk is incomplete – those exposures are themselves moving targets, and the biggest surprises in options trading often come from a second-order effect nobody was tracking, not from the primary Greek everyone was watching. Reading the Greeks together, rather than one at a time, is the difference between reacting to a position after it moves and understanding why it moved in the first place.
Frequently Asked Questions
Is Delta really the probability of an option expiring in the money?
It’s a close approximation, not an exact probability. Delta and the true probability of finishing in the money are related but distinct quantities that happen to be numerically similar under common assumptions – they can diverge, particularly with skewed volatility or far-dated expirations.
Does theta decay always accelerate as expiration approaches?
Only for at-the-money options. In-the-money options have a small, fairly flat theta since most of their value is intrinsic and doesn’t decay. Out-of-the-money options often see theta peak before expiration and then fade, since there’s little value left to lose in the final days.
What happens to the Greeks when implied volatility spikes?
More than just Vega moves. Vanna shifts Delta even without the stock moving, Vomma changes how sensitive Vega itself is to further IV moves, and Zomma changes Gamma. A single IV spike can move several Greeks at once, not just the one directly tied to volatility.
What is Vanna in simple terms?
Vanna measures how much Delta changes when implied volatility changes. It explains why a position’s directional exposure can shift meaningfully during a volatility event even if the underlying price hasn’t moved at all.
What is Charm in simple terms?
Charm measures how much Delta changes purely from the passage of time. It’s why an option’s directional exposure can drift day to day even on a completely flat, unmoving stock.