
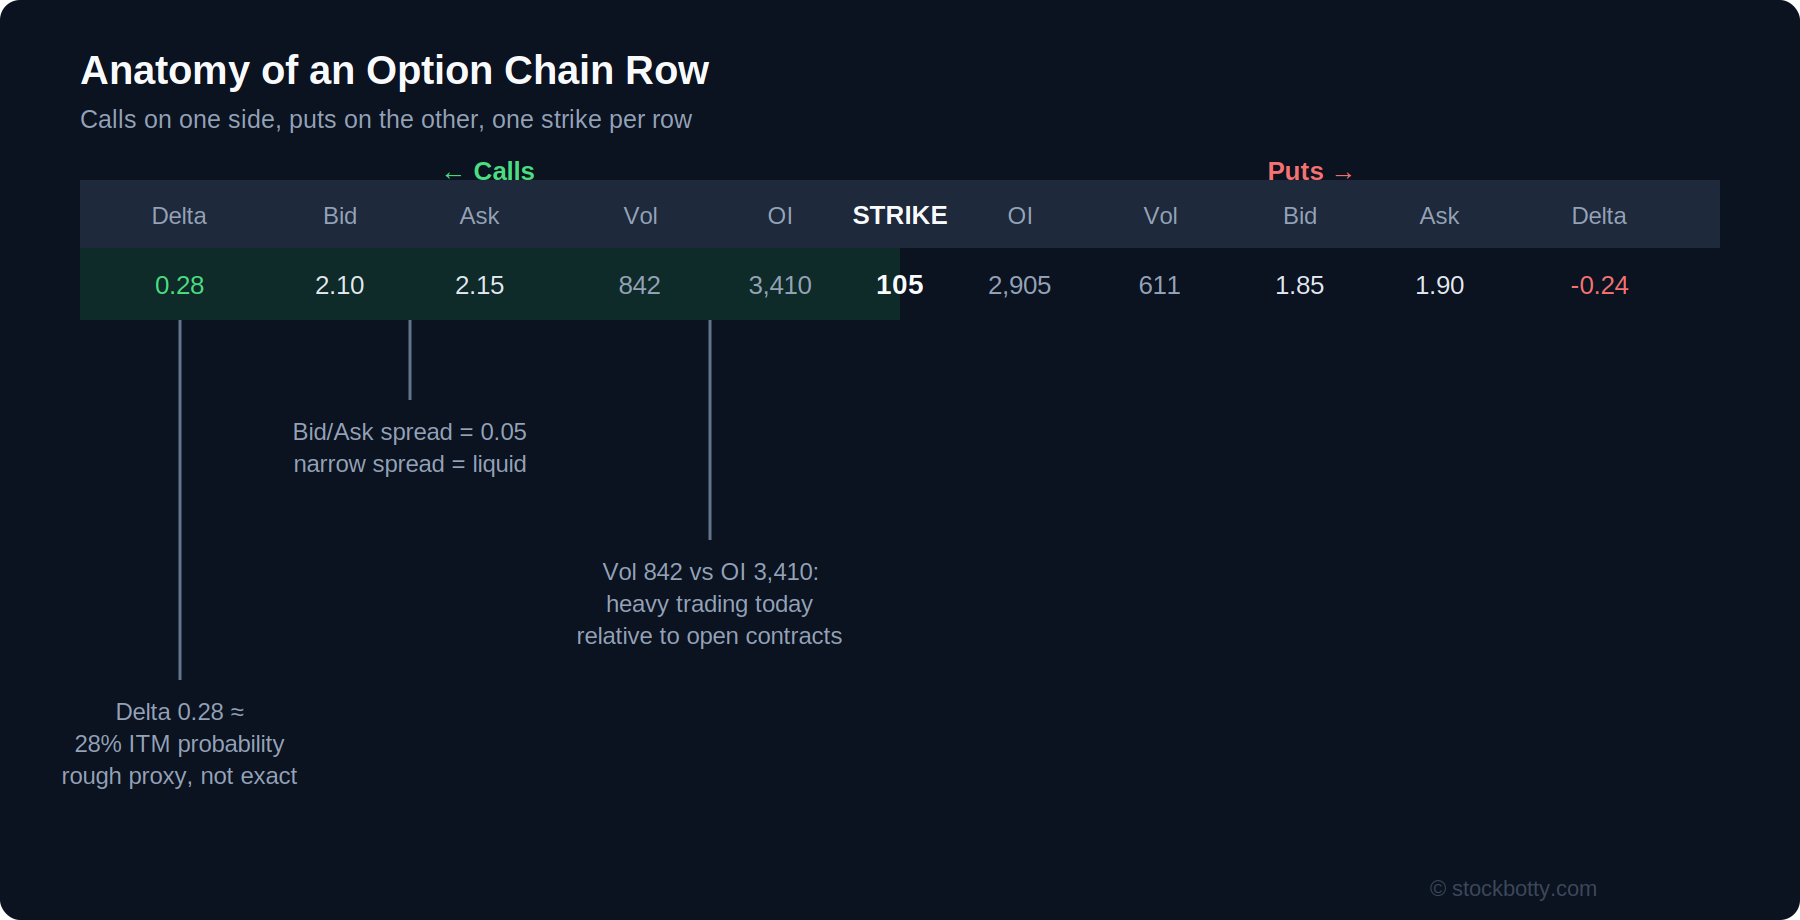
An option chain looks dense the first time it’s opened – rows of numbers stretching across the screen for every strike at every expiration. Once the columns are understood individually, though, it’s a consistent, repeatable layout across almost every broker platform. This page walks through what each part actually shows and how it gets used in practice.
The Basic Layout
Calls are typically shown on one side, puts on the other, with a single column of strike prices running down the middle shared by both. Each row corresponds to one strike; a separate selector – often a row of expiration dates across the top – controls which expiration’s strikes are currently displayed. Most platforms shade in-the-money strikes differently from out-of-the-money ones, making it easy to see where the current stock price sits relative to the strikes listed at a glance.
Bid, Ask, and the Spread
The bid is the highest price a buyer is currently willing to pay; the ask is the lowest price a seller is currently willing to accept. The gap between them – the bid-ask spread – is a direct signal of liquidity. A narrow spread means the contract trades actively enough that buyers and sellers are close to agreement; a wide spread means there’s less trading activity, and an order may need to be worked closer to the midpoint, or accept a worse fill, to get executed.
Volume vs. Open Interest
These two numbers are commonly confused, and they measure genuinely different things:
- Volume counts how many contracts have traded during the current session. It resets to zero every day.
- Open interest counts the total number of contracts currently outstanding – still open, not yet closed or expired. It only changes when a trade opens a new position or closes an existing one, not simply when contracts change hands between two parties who both already had positions.
A strike with high open interest but low volume today has significant existing positioning but little fresh activity. A strike with high volume relative to its open interest suggests unusually active trading relative to how much is normally outstanding there – the kind of signal that shows up in unusual options activity detection.
Implied Volatility
Most chains display implied volatility per contract, letting the skew across strikes covered in the implied volatility guide be seen directly – scanning down the IV column at a single expiration usually shows exactly the skewed pattern described there, higher on the put side than the call side for most equities.
Delta as a Strike-Selection Shortcut
Many chains display delta directly alongside each strike, which is what makes the delta-based strike selection convention used throughout this site’s strategy guides practical in real time – rather than calculating a target strike from a stock price and an assumed probability, a trader can simply scan the delta column for strikes in the desired range, commonly 20-30 delta for the short strikes covered across most premium-selling strategies on this site.
A Practical Walkthrough
Reading the example row above: the 105 strike shows a 0.28 delta call trading at a 2.10/2.15 bid-ask spread, with 842 contracts traded today against 3,410 open interest – a reasonably liquid, moderately active strike. The narrow five-cent spread suggests an order near the midpoint (around 2.12) would likely fill without much slippage. On the put side of the same row, the 105 strike shows a -0.24 delta, trading 1.85/1.90 – the asymmetry between the call and put deltas at the same strike, and their different pricing, is the skew described in the implied volatility guide showing up directly in the chain itself.
Frequently Asked Questions
How is an option chain laid out?
Calls are typically shown on one side, puts on the other, with a column of strike prices running down the middle. Each row represents a single strike, and a separate selector controls which expiration date is being displayed.
What is the difference between volume and open interest?
Volume counts contracts traded during the current session and resets every day. Open interest counts the total number of contracts still outstanding, and only changes when positions are opened or closed rather than simply traded.
Why does the bid-ask spread matter when reading a chain?
A narrow bid-ask spread generally indicates a liquid contract, where orders can be filled close to the midpoint price. A wide spread suggests thinner liquidity, where the actual fill price may be meaningfully worse than the quoted midpoint.
Can I use delta to pick a strike directly from the chain?
Yes, this is common practice. Since delta is a rough proxy for the probability of finishing in the money, many traders scan the delta column directly to find strikes in a target range, such as the 20-30 delta convention used throughout this site.
What does it mean when a strike is highlighted differently on the chain?
Most platforms shade in-the-money strikes differently from out-of-the-money ones, making it easy to see at a glance where the current stock price sits relative to the strikes listed.