
IV-Rank and IV Percentile, covered on the strategies overview, describe whether implied volatility is currently high or low relative to its own history. This page covers what implied volatility actually is in the first place, and a dimension that isn’t a single number at all: the fact that IV varies across both time (term structure) and strike (skew) for the very same underlying, at the very same moment.
What Implied Volatility Actually Is
Implied volatility isn’t directly observed – it’s backed out from an option’s market price. An option pricing model takes the stock price, strike, time to expiration, interest rates, and a volatility estimate as inputs, and produces a theoretical option price as output. Implied volatility is the volatility figure that makes that theoretical price match the option’s actual market price. In other words, it’s the market’s collective, forward-looking estimate of future volatility, reverse-engineered from what traders are actually willing to pay.
This is a fundamentally different measurement from historical (or realized) volatility, which simply measures how much a stock has actually moved over some past period. Historical volatility looks backward at what happened; implied volatility looks forward at what the market currently expects, priced into today’s options. The two are related – historical volatility informs expectations – but they routinely diverge, sometimes significantly, particularly around anticipated events.
IV Term Structure: Volatility Across Expirations
For the same strike, implied volatility often differs across different expiration dates – this is the term structure already covered in more depth in the calendar spread guide. Normally, longer-dated options carry somewhat higher IV than near-term ones (more time for uncertainty to resolve into a range of outcomes). Ahead of a known event – earnings, a major announcement – near-term IV can spike above longer-dated IV instead, a pattern called backwardation, since the market is pricing in an outsized move specifically around that near-term date.
IV Skew: Volatility Across Strikes
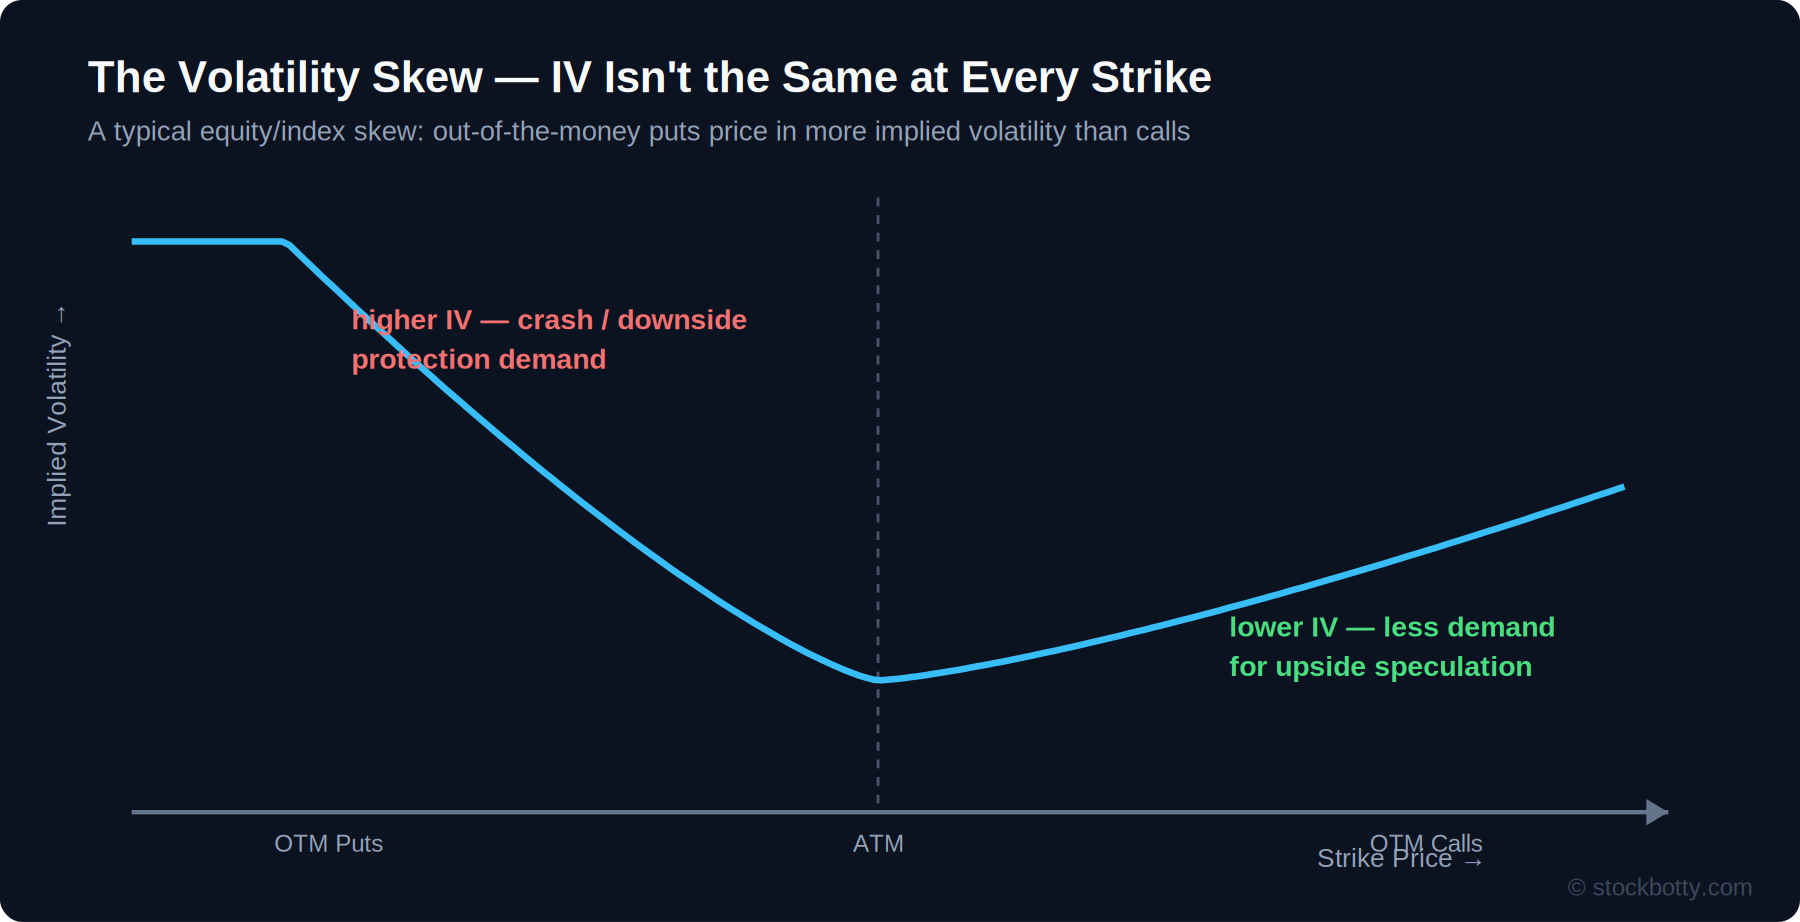
If option pricing worked exactly the way a simple model assumes, implied volatility would be identical across every strike at a given expiration – a flat line. In practice, it isn’t. For most equities and indexes, out-of-the-money puts trade at meaningfully higher implied volatility than out-of-the-money calls at a similar distance from the current price. Plotted against strike, this produces a downward-sloping curve from left (low strikes, high IV) to right (high strikes, lower IV) – commonly called the volatility skew, or sometimes the “smirk” for its characteristic shape.
Some other asset classes, particularly currencies, exhibit a more symmetric pattern instead – IV rising on both the put and call sides relative to at-the-money options, producing a U-shaped curve called a volatility smile rather than a one-sided skew.
Why the Skew Exists
- Demand for downside protection: institutions and individual investors regularly buy puts to hedge existing long stock positions, creating persistent buying pressure on puts that bids up their price and implied volatility relative to calls.
- The empirical tendency for declines to be sharper than rallies: stocks historically tend to fall faster than they rise – sharp selloffs happen more abruptly than sharp rallies – and option pricing reflects that asymmetry in the relative cost of protecting against each direction.
- Leverage effects: as a stock’s price falls, the same company’s remaining equity becomes proportionally more leveraged against its debt, which can mechanically increase the stock’s volatility – a dynamic that reinforces higher pricing for downside scenarios specifically.
Why Skew Matters for Strategy Selection
Skew isn’t just a theoretical curiosity – it directly affects several strategies already covered on this site:
- Ratio spreads and broken wing butterflies are inherently asymmetric structures, and skew changes the relative pricing of the strikes involved on the put side versus the call side, affecting whether a given structure can actually be built for a net credit.
- Iron condors built with strikes placed at similar deltas on both sides will generally collect a richer credit on the put side than the call side, purely because of skew, even though both sides are nominally “the same distance away” in probability terms.
- Jade lizards specifically exploit skew’s practical effect – the elevated put-side IV that comes with selling a put is part of what makes it easier to collect enough total credit to cover the call spread’s width, the design principle covered in that guide.
IV-Rank and IV Percentile: A Different Dimension
IV-Rank and IV Percentile, covered on the strategies overview, measure something different from skew: not how IV varies across strikes right now, but whether the general level of IV is high or low relative to its own recent history. A stock can have a pronounced skew regardless of whether its overall IV-Rank is high or low – skew describes the shape of the volatility curve at a moment in time, while IV-Rank describes where that curve’s general level sits historically.
Frequently Asked Questions
What is implied volatility?
The volatility figure that, when plugged into an option pricing model, produces the option’s current market price. It’s backed out from the price rather than observed directly, and represents the market’s forward-looking estimate of future volatility, not a prediction with any guaranteed accuracy.
What is the difference between implied and historical volatility?
Historical (or realized) volatility measures how much a stock has actually moved in the past. Implied volatility is forward-looking, reflecting what the options market is currently pricing in for future movement. The two are related but frequently diverge.
What is the volatility skew?
The pattern where implied volatility differs across strikes at the same expiration. For most equities and indexes, out-of-the-money puts carry higher implied volatility than out-of-the-money calls, reflecting stronger demand for downside protection.
What is the difference between skew and a volatility smile?
Skew describes an asymmetric pattern, typically higher IV on the put side than the call side for equities. A smile describes a more symmetric pattern where IV rises on both the put and call sides relative to at-the-money options, more common in certain asset classes like currencies.
Why does the volatility skew exist?
Largely from demand for downside protection – investors and institutions buy puts to hedge against sharp declines, bidding up their price and implied volatility relative to calls. It also reflects the empirical tendency for stocks to fall faster than they rise.